
 Yahoo Finance
 CF Energy Corp. (CVE:CFY) Earns Among The Best Returns In Its Industry

Today we'll evaluate CF Energy Corp. (CVE:CFY) to determine whether it could have potential as an investment idea. In particular, we'll consider its Return On Capital Employed (ROCE), as that can give us insight into how profitably the company is able to employ capital in its business.
First, we'll go over how we calculate ROCE. Second, we'll look at its ROCE compared to similar companies. Last but not least, we'll look at what impact its current liabilities have on its ROCE.
Understanding Return On Capital Employed (ROCE)
ROCE is a measure of a company's yearly pre-tax profit (its return), relative to the capital employed in the business. In general, businesses with a higher ROCE are usually better quality. Overall, it is a valuable metric that has its flaws. Renowned investment researcher Michael Mauboussin has suggested that a high ROCE can indicate that 'one dollar invested in the company generates value of more than one dollar'.
So, How Do We Calculate ROCE?
The formula for calculating the return on capital employed is:
Return on Capital Employed = Earnings Before Interest and Tax (EBIT) ÷ (Total Assets - Current Liabilities)
Or for CF Energy:
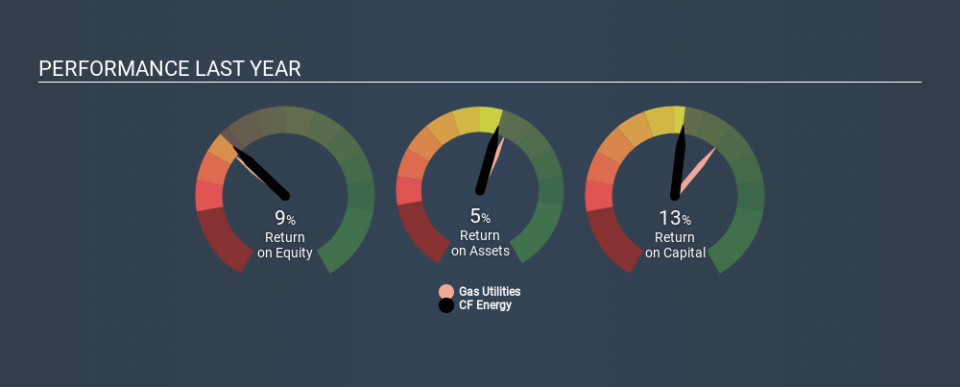
0.13 = CN¥63m ÷ (CN¥714m - CN¥219m) (Based on the trailing twelve months to September 2019.)
Therefore, CF Energy has an ROCE of 13%.
View our latest analysis for CF Energy
Is CF Energy's ROCE Good?
ROCE is commonly used for comparing the performance of similar businesses. CF Energy's ROCE appears to be substantially greater than the 7.8% average in the Gas Utilities industry. I think that's good to see, since it implies the company is better than other companies at making the most of its capital. Independently of how CF Energy compares to its industry, its ROCE in absolute terms appears decent, and the company may be worthy of closer investigation.
You can click on the image below to see (in greater detail) how CF Energy's past growth compares to other companies.
Remember that this metric is backwards looking - it shows what has happened in the past, and does not accurately predict the future. ROCE can be misleading for companies in cyclical industries, with returns looking impressive during the boom times, but very weak during the busts. ROCE is only a point-in-time measure. You can check if CF Energy has cyclical profits by looking at this free graph of past earnings, revenue and cash flow.
Do CF Energy's Current Liabilities Skew Its ROCE?
Current liabilities include invoices, such as supplier payments, short-term debt, or a tax bill, that need to be paid within 12 months. Due to the way ROCE is calculated, a high level of current liabilities makes a company look as though it has less capital employed, and thus can (sometimes unfairly) boost the ROCE. To counteract this, we check if a company has high current liabilities, relative to its total assets.
CF Energy has total assets of CN¥714m and current liabilities of CN¥219m. Therefore its current liabilities are equivalent to approximately 31% of its total assets. With this level of current liabilities, CF Energy's ROCE is boosted somewhat.
What We Can Learn From CF Energy's ROCE
With a decent ROCE, the company could be interesting, but remember that the level of current liabilities make the ROCE look better. There might be better investments than CF Energy out there, but you will have to work hard to find them . These promising businesses with rapidly growing earnings might be right up your alley.
If you like to buy stocks alongside management, then you might just love this free list of companies. (Hint: insiders have been buying them).
If you spot an error that warrants correction, please contact the editor at editorial-team@simplywallst.com. This article by Simply Wall St is general in nature. It does not constitute a recommendation to buy or sell any stock, and does not take account of your objectives, or your financial situation. Simply Wall St has no position in the stocks mentioned.
We aim to bring you long-term focused research analysis driven by fundamental data. Note that our analysis may not factor in the latest price-sensitive company announcements or qualitative material. Thank you for reading.
