
 Yahoo Finance
 Cerner Corporation (NASDAQ:CERN): Does The -16% Earnings Drop Reflect A Longer Term Trend?

After looking at Cerner Corporation's (NasdaqGS:CERN) latest earnings announcement (28 December 2019), I found it useful to revisit the company's performance in the past couple of years and assess this against the most recent figures. As a long term investor, I pay close attention to earnings trend, rather than the figures published at one point in time. I also compare against an industry benchmark to check whether Cerner's performance has been impacted by industry movements. In this article I briefly touch on my key findings.
View our latest analysis for Cerner
Did CERN perform worse than its track record and industry?
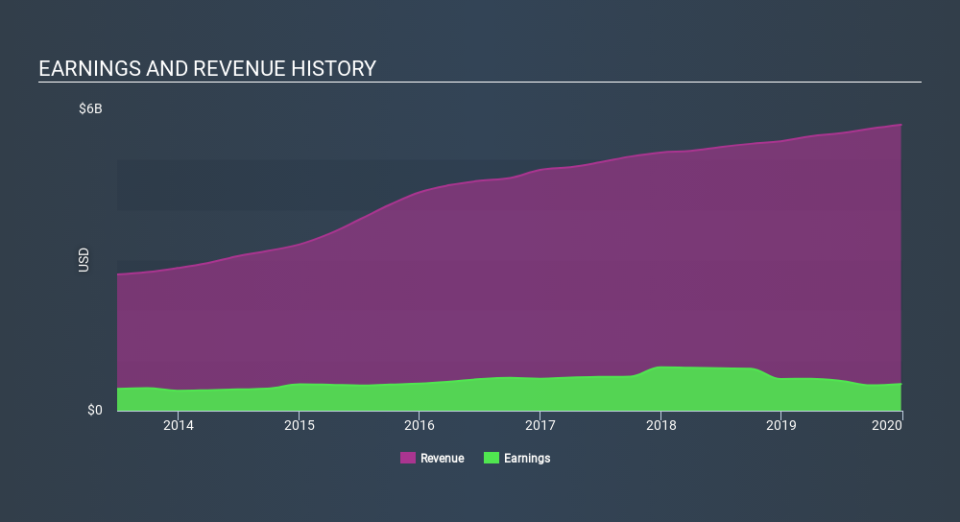
CERN's trailing twelve-month earnings (from 28 December 2019) of US$529m has declined by -16% compared to the previous year.
Furthermore, this one-year growth rate has been lower than its average earnings growth rate over the past 5 years of 4.3%, indicating the rate at which CERN is growing has slowed down. What could be happening here? Let's examine what's transpiring with margins and whether the whole industry is feeling the heat.
In terms of returns from investment, Cerner has fallen short of achieving a 20% return on equity (ROE), recording 12% instead. However, its return on assets (ROA) of 7.3% exceeds the US Healthcare Services industry of 5.3%, indicating Cerner has used its assets more efficiently. Though, its return on capital (ROC), which also accounts for Cerner’s debt level, has declined over the past 3 years from 20% to 12%. This correlates with an increase in debt holding, with debt-to-equity ratio rising from 3.7% to 24% over the past 5 years.
What does this mean?
Cerner's track record can be a valuable insight into its earnings performance, but it certainly doesn't tell the whole story. Typically companies that endure a prolonged period of reduction in earnings are undergoing some sort of reinvestment phase with the aim of keeping up with the recent industry growth and disruption. I recommend you continue to research Cerner to get a better picture of the stock by looking at:
Future Outlook: What are well-informed industry analysts predicting for CERN’s future growth? Take a look at our free research report of analyst consensus for CERN’s outlook.
Financial Health: Are CERN’s operations financially sustainable? Balance sheets can be hard to analyze, which is why we’ve done it for you. Check out our financial health checks here.
Other High-Performing Stocks: Are there other stocks that provide better prospects with proven track records? Explore our free list of these great stocks here.
NB: Figures in this article are calculated using data from the trailing twelve months from 28 December 2019. This may not be consistent with full year annual report figures.
If you spot an error that warrants correction, please contact the editor at editorial-team@simplywallst.com. This article by Simply Wall St is general in nature. It does not constitute a recommendation to buy or sell any stock, and does not take account of your objectives, or your financial situation. Simply Wall St has no position in the stocks mentioned.
We aim to bring you long-term focused research analysis driven by fundamental data. Note that our analysis may not factor in the latest price-sensitive company announcements or qualitative material. Thank you for reading.
