SITE Centers' (SITC) Q2 FFO & Revenues Top Estimates, NOI Up
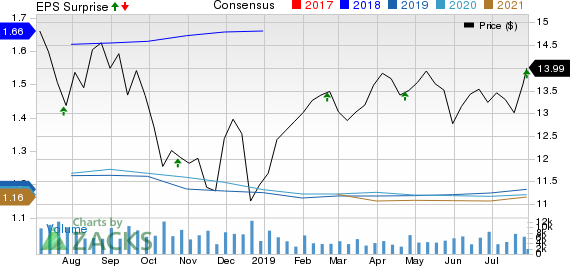
SITE Centers Corp. SITC posted second-quarter 2019 operating funds from operations (OFFO) per share of 31 cents, surpassing the Zacks Consensus Estimate of 28 cents.
Results reflect growth in same-store net operating income (NOI). The company, on a pro-rata basis, generated new and renewal leasing spreads of 7.1% and 5.1%, respectively, in the second quarter.
However, the operating FFO per share figure compares unfavorably with the prior-year quarter’s reported tally of 49 cents. This year-over-year decline reflects the dilutive impact of the company’s RVI spin-off, partially offset by lower interest expense and higher fee income.
The company generated revenues of $113.5 million in the quarter, beating the Zacks Consensus Estimate of $110.7 million. The top-line figure, however, came in lower than the $204.3 million recorded in the comparable period last year.
Quarter in Detail
Same-store NOI growth for the total portfolio on a pro-rata basis was 5.7% in the second quarter. SITE Centers reported a leased rate of 93.9% as of Jun 30, 2019, compared with 93.1% in the prior-year period, on a pro-rata basis.
Annualized base rent per occupied square-foot for the total portfolio was $17.98 on a pro-rata basis as of Jun 30, 2019, up from $17.36 recorded a year ago.
SITE Centers sold two shopping centers for $37.8 million ($7.3 million at the company’s share) during the reported quarter. This included $1.2 million from the repayment of SITC Centers’ preferred equity investment in two joint ventures with Blackstone.
Finally, SITE Centers exited the June-end quarter with $9.4 million in cash compared with approximately $11.1 million as of Dec 31, 2018.
Outlook
The company updated its operating FFO per share outlook to $1.18-$1.22 from the prior estimate of $1.14-$1.19. The Zacks Consensus Estimate for the same is pegged at $1.18. Furthermore, the guidance for same-store net operating income has been revised to 1.25-3.25% compared to the previous projection of 1.25-2%.
Bottom Line
Strong leasing momentum and decent rent growth buoyed SITC Centers’ quarterly performance. Further, the company remains on-track to meet its five-year business plan targets to invest $75 million annually on property acquisitions through capital recycling and another $100 million on redevelopment opportunities.
Nonetheless, the dilutive impact of the Retail Value Inc. spin-off keeps impeding the company’s bottom-line growth.
SITE CENTERS CORP. Price, Consensus and EPS Surprise

SITE CENTERS CORP. price-consensus-eps-surprise-chart | SITE CENTERS CORP. Quote
SITE Centers carries a Zacks Rank #3 (Hold), at present. You can see the complete list of today’s Zacks #1 Rank (Strong Buy) stocks here.
Performance of Other REITs
Taubman Centers Inc. TCO reported second-quarter adjusted FFO per share of 94 cents, beating the Zacks Consensus Estimate of 83 cents. The figure also compared favorably with the year-ago quarter’s reported tally of 87 cents.
Kimco Realty Corp.’s KIM second-quarter 2019 FFO as adjusted came in at 36 cents per share, in line with the Zacks Consensus Estimate. The reported tally came in a penny less than the year-earlier quarter’s FFO as adjusted of 37 cents per share.
PS Business Parks, Inc. PSB posted second-quarter 2019 FFO of $1.75 per share, which outpaced the Zacks Consensus Estimate of $1.68. The figure also came in 10.1% higher than the prior-year quarter’s $1.59.
Note: Anything related to earnings presented in this write-up represent funds from operations (FFO) — a widely used metric to gauge the performance of REITs.
Today's Best Stocks from Zacks
Would you like to see the updated picks from our best market-beating strategies? From 2017 through 2018, while the S&P 500 gained +15.8%, five of our screens returned +38.0%, +61.3%, +61.6%, +68.1%, and +98.3%.
This outperformance has not just been a recent phenomenon. From 2000 – 2018, while the S&P averaged +4.8% per year, our top strategies averaged up to +56.2% per year.
See their latest picks free >>
Want the latest recommendations from Zacks Investment Research? Today, you can download 7 Best Stocks for the Next 30 Days. Click to get this free report
Taubman Centers, Inc. (TCO) : Free Stock Analysis Report
Kimco Realty Corporation (KIM) : Free Stock Analysis Report
PS Business Parks, Inc. (PSB) : Free Stock Analysis Report
SITE CENTERS CORP. (SITC) : Free Stock Analysis Report
To read this article on Zacks.com click here.
Zacks Investment Research

 Yahoo Finance