
 Yahoo Finance
 What Is CenterPoint Energy's (NYSE:CNP) P/E Ratio After Its Share Price Tanked?

To the annoyance of some shareholders, CenterPoint Energy (NYSE:CNP) shares are down a considerable 51% in the last month. That drop has capped off a tough year for shareholders, with the share price down 59% in that time.
Assuming nothing else has changed, a lower share price makes a stock more attractive to potential buyers. In the long term, share prices tend to follow earnings per share, but in the short term prices bounce around in response to short term factors (which are not always obvious). So, on certain occasions, long term focussed investors try to take advantage of pessimistic expectations to buy shares at a better price. One way to gauge market expectations of a stock is to look at its Price to Earnings Ratio (PE Ratio). A high P/E ratio means that investors have a high expectation about future growth, while a low P/E ratio means they have low expectations about future growth.
Check out our latest analysis for CenterPoint Energy
How Does CenterPoint Energy's P/E Ratio Compare To Its Peers?
CenterPoint Energy's P/E of 9.30 indicates relatively low sentiment towards the stock. We can see in the image below that the average P/E (15.7) for companies in the integrated utilities industry is higher than CenterPoint Energy's P/E.
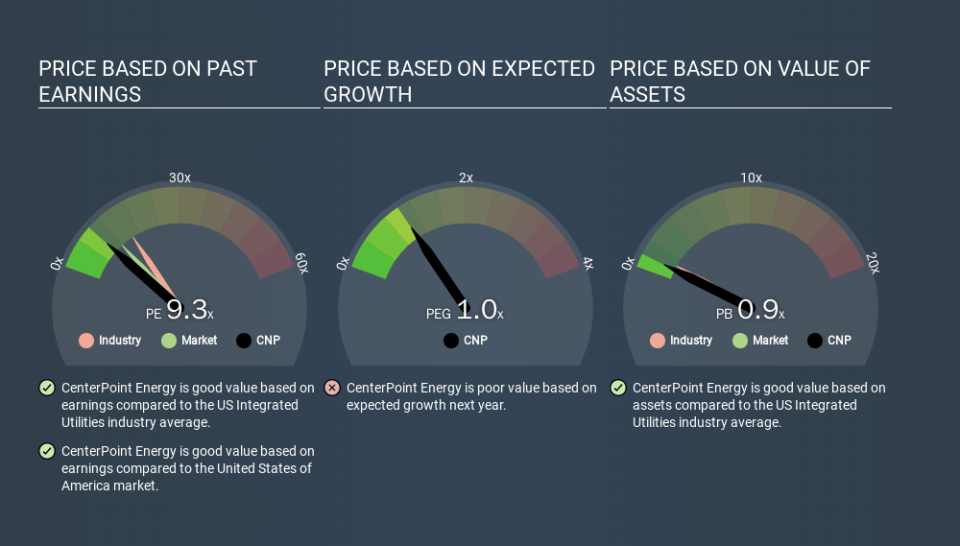
This suggests that market participants think CenterPoint Energy will underperform other companies in its industry. Many investors like to buy stocks when the market is pessimistic about their prospects. You should delve deeper. I like to check if company insiders have been buying or selling.
How Growth Rates Impact P/E Ratios
Probably the most important factor in determining what P/E a company trades on is the earnings growth. When earnings grow, the 'E' increases, over time. That means unless the share price increases, the P/E will reduce in a few years. A lower P/E should indicate the stock is cheap relative to others -- and that may attract buyers.
In the last year, CenterPoint Energy grew EPS like Taylor Swift grew her fan base back in 2010; the 81% gain was both fast and well deserved. Having said that, the average EPS growth over the last three years wasn't so good, coming in at 10%. Regrettably, the longer term performance is poor, with EPS down 1.1% per year over 5 years.
A Limitation: P/E Ratios Ignore Debt and Cash In The Bank
One drawback of using a P/E ratio is that it considers market capitalization, but not the balance sheet. In other words, it does not consider any debt or cash that the company may have on the balance sheet. The exact same company would hypothetically deserve a higher P/E ratio if it had a strong balance sheet, than if it had a weak one with lots of debt, because a cashed up company can spend on growth.
Spending on growth might be good or bad a few years later, but the point is that the P/E ratio does not account for the option (or lack thereof).
How Does CenterPoint Energy's Debt Impact Its P/E Ratio?
CenterPoint Energy has net debt worth a very significant 224% of its market capitalization. This level of debt justifies a relatively low P/E, so remain cognizant of the debt, if you're comparing it to other stocks.
The Bottom Line On CenterPoint Energy's P/E Ratio
CenterPoint Energy's P/E is 9.3 which is below average (11.8) in the US market. While the EPS growth last year was strong, the significant debt levels reduce the number of options available to management. If it continues to grow, then the current low P/E may prove to be unjustified. What can be absolutely certain is that the market has become more pessimistic about CenterPoint Energy over the last month, with the P/E ratio falling from 18.8 back then to 9.3 today. For those who prefer to invest with the flow of momentum, that might be a bad sign, but for deep value investors this stock might justify some research.
Investors should be looking to buy stocks that the market is wrong about. If the reality for a company is not as bad as the P/E ratio indicates, then the share price should increase as the market realizes this. So this free visualization of the analyst consensus on future earnings could help you make the right decision about whether to buy, sell, or hold.
Of course, you might find a fantastic investment by looking at a few good candidates. So take a peek at this free list of companies with modest (or no) debt, trading on a P/E below 20.
If you spot an error that warrants correction, please contact the editor at editorial-team@simplywallst.com. This article by Simply Wall St is general in nature. It does not constitute a recommendation to buy or sell any stock, and does not take account of your objectives, or your financial situation. Simply Wall St has no position in the stocks mentioned.
We aim to bring you long-term focused research analysis driven by fundamental data. Note that our analysis may not factor in the latest price-sensitive company announcements or qualitative material. Thank you for reading.
