
 Yahoo Finance
 Is Celestica Inc.'s (TSE:CLS) CEO Salary Justified?

In 2015 Rob Mionis was appointed CEO of Celestica Inc. (TSE:CLS). First, this article will compare CEO compensation with compensation at similar sized companies. Then we'll look at a snap shot of the business growth. And finally - as a second measure of performance - we will look at the returns shareholders have received over the last few years. The aim of all this is to consider the appropriateness of CEO pay levels.
See our latest analysis for Celestica
How Does Rob Mionis's Compensation Compare With Similar Sized Companies?
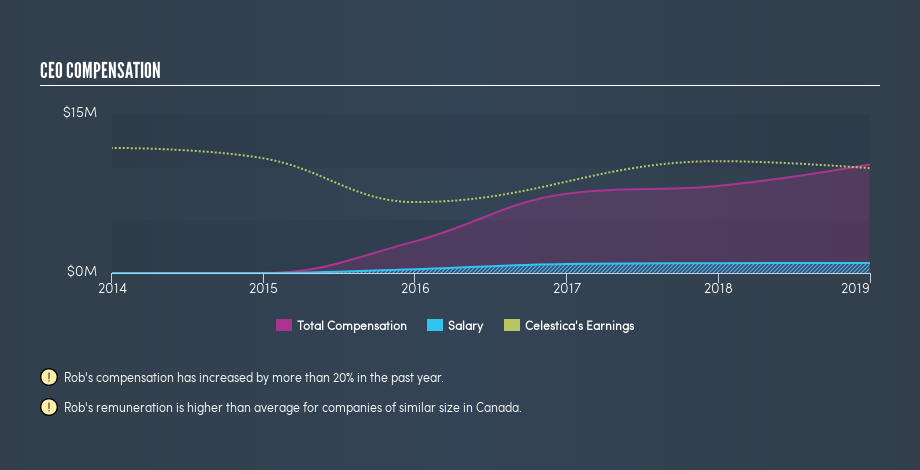
Our data indicates that Celestica Inc. is worth CA$1.5b, and total annual CEO compensation is US$10m. (This number is for the twelve months until December 2018). That's a notable increase of 25% on last year. While we always look at total compensation first, we note that the salary component is less, at US$950k. We examined companies with market caps from US$400m to US$1.6b, and discovered that the median CEO total compensation of that group was US$1.5m.
It would therefore appear that Celestica Inc. pays Rob Mionis more than the median CEO remuneration at companies of a similar size, in the same market. However, this fact alone doesn't mean the remuneration is too high. A closer look at the performance of the underlying business will give us a better idea about whether the pay is particularly generous.
The graphic below shows how CEO compensation at Celestica has changed from year to year.
Is Celestica Inc. Growing?
On average over the last three years, Celestica Inc. has shrunk earnings per share by 1.2% each year (measured with a line of best fit). Its revenue is up 8.0% over last year.
The lack of earnings per share growth in the last three years is unimpressive. The modest increase in revenue in the last year isn't enough to make me overlook the disappointing change in earnings per share. It's hard to argue the company is firing on all cylinders, so shareholders might be averse to high CEO remuneration. Shareholders might be interested in this free visualization of analyst forecasts.
Has Celestica Inc. Been A Good Investment?
Since shareholders would have lost about 14% over three years, some Celestica Inc. shareholders would surely be feeling negative emotions. This suggests it would be unwise for the company to pay the CEO too generously.
In Summary...
We compared the total CEO remuneration paid by Celestica Inc., and compared it to remuneration at a group of similar sized companies. We found that it pays well over the median amount paid in the benchmark group.
Earnings per share have not grown in three years, and the revenue growth fails to impress us.
Arguably worse, investors are without a positive return for the last three years. And we'd be remiss not to note that the CEO remuneration has increased on last year. This analysis suggests to us that the CEO is paid too generously! If you think CEO compensation levels are interesting you will probably really like this free visualization of insider trading at Celestica.
If you want to buy a stock that is better than Celestica, this free list of high return, low debt companies is a great place to look.
We aim to bring you long-term focused research analysis driven by fundamental data. Note that our analysis may not factor in the latest price-sensitive company announcements or qualitative material.
If you spot an error that warrants correction, please contact the editor at editorial-team@simplywallst.com. This article by Simply Wall St is general in nature. It does not constitute a recommendation to buy or sell any stock, and does not take account of your objectives, or your financial situation. Simply Wall St has no position in the stocks mentioned. Thank you for reading.