
 Yahoo Finance
 CCL Industries (TSE:CCL.B) shareholders have earned a 11% CAGR over the last three years
Investors can buy low cost index fund if they want to receive the average market return. But across the board there are plenty of stocks that underperform the market. For example, the CCL Industries Inc. (TSE:CCL.B) share price return of 33% over three years lags the market return in the same period. In the last year the stock has gained 17%.
With that in mind, it's worth seeing if the company's underlying fundamentals have been the driver of long term performance, or if there are some discrepancies.
View our latest analysis for CCL Industries
To paraphrase Benjamin Graham: Over the short term the market is a voting machine, but over the long term it's a weighing machine. One way to examine how market sentiment has changed over time is to look at the interaction between a company's share price and its earnings per share (EPS).
CCL Industries was able to grow its EPS at 4.0% per year over three years, sending the share price higher. This EPS growth is lower than the 10% average annual increase in the share price. This suggests that, as the business progressed over the last few years, it gained the confidence of market participants. It's not unusual to see the market 're-rate' a stock, after a few years of growth.
You can see how EPS has changed over time in the image below (click on the chart to see the exact values).
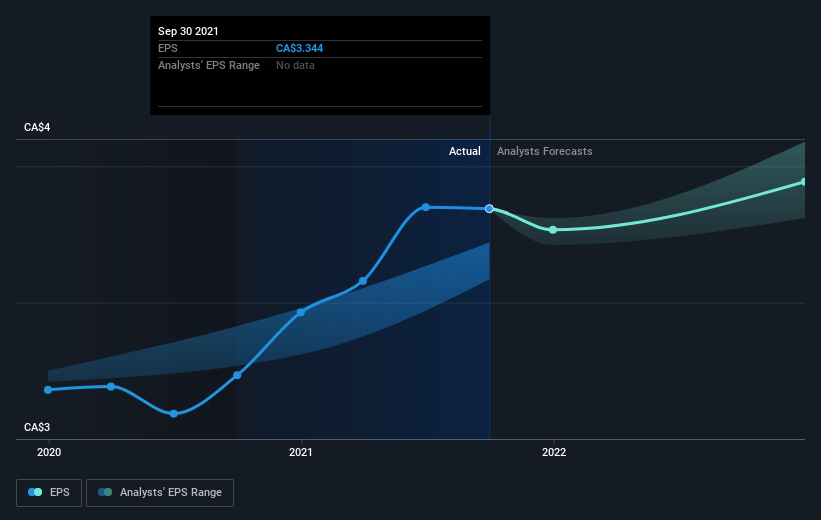
We know that CCL Industries has improved its bottom line lately, but is it going to grow revenue? Check if analysts think CCL Industries will grow revenue in the future.
What About Dividends?
As well as measuring the share price return, investors should also consider the total shareholder return (TSR). Whereas the share price return only reflects the change in the share price, the TSR includes the value of dividends (assuming they were reinvested) and the benefit of any discounted capital raising or spin-off. It's fair to say that the TSR gives a more complete picture for stocks that pay a dividend. In the case of CCL Industries, it has a TSR of 38% for the last 3 years. That exceeds its share price return that we previously mentioned. And there's no prize for guessing that the dividend payments largely explain the divergence!
A Different Perspective
CCL Industries provided a TSR of 18% over the last twelve months. But that was short of the market average. On the bright side, that's still a gain, and it's actually better than the average return of 7% over half a decade This suggests the company might be improving over time. Most investors take the time to check the data on insider transactions. You can click here to see if insiders have been buying or selling.
But note: CCL Industries may not be the best stock to buy. So take a peek at this free list of interesting companies with past earnings growth (and further growth forecast).
Please note, the market returns quoted in this article reflect the market weighted average returns of stocks that currently trade on CA exchanges.
Have feedback on this article? Concerned about the content? Get in touch with us directly. Alternatively, email editorial-team (at) simplywallst.com.
This article by Simply Wall St is general in nature. We provide commentary based on historical data and analyst forecasts only using an unbiased methodology and our articles are not intended to be financial advice. It does not constitute a recommendation to buy or sell any stock, and does not take account of your objectives, or your financial situation. We aim to bring you long-term focused analysis driven by fundamental data. Note that our analysis may not factor in the latest price-sensitive company announcements or qualitative material. Simply Wall St has no position in any stocks mentioned.
