
 Yahoo Finance
 Cautious Investors Not Rewarding SNDL Inc.'s (NASDAQ:SNDL) Performance Completely
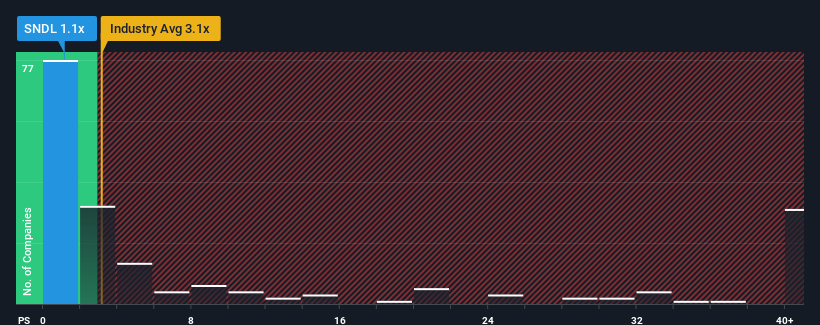
You may think that with a price-to-sales (or "P/S") ratio of 1.1x SNDL Inc. (NASDAQ:SNDL) is a stock worth checking out, seeing as almost half of all the Pharmaceuticals companies in the United States have P/S ratios greater than 3.1x and even P/S higher than 16x aren't out of the ordinary. However, the P/S might be low for a reason and it requires further investigation to determine if it's justified.
See our latest analysis for SNDL
How SNDL Has Been Performing
SNDL certainly has been doing a good job lately as it's been growing revenue more than most other companies. One possibility is that the P/S ratio is low because investors think this strong revenue performance might be less impressive moving forward. If not, then existing shareholders have reason to be quite optimistic about the future direction of the share price.
Keen to find out how analysts think SNDL's future stacks up against the industry? In that case, our free report is a great place to start.
What Are Revenue Growth Metrics Telling Us About The Low P/S?
There's an inherent assumption that a company should underperform the industry for P/S ratios like SNDL's to be considered reasonable.
Retrospectively, the last year delivered an explosive gain to the company's top line. The latest three year period has also seen an incredible overall rise in revenue, aided by its incredible short-term performance. So we can start by confirming that the company has done a tremendous job of growing revenue over that time.
Shifting to the future, estimates from the two analysts covering the company suggest revenue should grow by 31% per annum over the next three years. With the industry predicted to deliver 31% growth per annum, the company is positioned for a comparable revenue result.
With this in consideration, we find it intriguing that SNDL's P/S is lagging behind its industry peers. Apparently some shareholders are doubtful of the forecasts and have been accepting lower selling prices.
What We Can Learn From SNDL's P/S?
Typically, we'd caution against reading too much into price-to-sales ratios when settling on investment decisions, though it can reveal plenty about what other market participants think about the company.
It looks to us like the P/S figures for SNDL remain low despite growth that is expected to be in line with other companies in the industry. Despite average revenue growth estimates, there could be some unobserved threats keeping the P/S low. Perhaps investors are concerned that the company could underperform against the forecasts over the near term.
There are also other vital risk factors to consider before investing and we've discovered 1 warning sign for SNDL that you should be aware of.
If you're unsure about the strength of SNDL's business, why not explore our interactive list of stocks with solid business fundamentals for some other companies you may have missed.
Have feedback on this article? Concerned about the content? Get in touch with us directly. Alternatively, email editorial-team (at) simplywallst.com.
This article by Simply Wall St is general in nature. We provide commentary based on historical data and analyst forecasts only using an unbiased methodology and our articles are not intended to be financial advice. It does not constitute a recommendation to buy or sell any stock, and does not take account of your objectives, or your financial situation. We aim to bring you long-term focused analysis driven by fundamental data. Note that our analysis may not factor in the latest price-sensitive company announcements or qualitative material. Simply Wall St has no position in any stocks mentioned.
Join A Paid User Research Session
You’ll receive a US$30 Amazon Gift card for 1 hour of your time while helping us build better investing tools for the individual investors like yourself. Sign up here
