
 Yahoo Finance
 Cathedra Bitcoin (CVE:CBIT) Is Doing The Right Things To Multiply Its Share Price
To find a multi-bagger stock, what are the underlying trends we should look for in a business? One common approach is to try and find a company with returns on capital employed (ROCE) that are increasing, in conjunction with a growing amount of capital employed. Put simply, these types of businesses are compounding machines, meaning they are continually reinvesting their earnings at ever-higher rates of return. So when we looked at Cathedra Bitcoin (CVE:CBIT) and its trend of ROCE, we really liked what we saw.
What is Return On Capital Employed (ROCE)?
For those who don't know, ROCE is a measure of a company's yearly pre-tax profit (its return), relative to the capital employed in the business. Analysts use this formula to calculate it for Cathedra Bitcoin:
Return on Capital Employed = Earnings Before Interest and Tax (EBIT) ÷ (Total Assets - Current Liabilities)
0.03 = CA$1.6m ÷ (CA$58m - CA$4.6m) (Based on the trailing twelve months to December 2021).
Therefore, Cathedra Bitcoin has an ROCE of 3.0%. Ultimately, that's a low return and it under-performs the Software industry average of 8.4%.
Check out our latest analysis for Cathedra Bitcoin
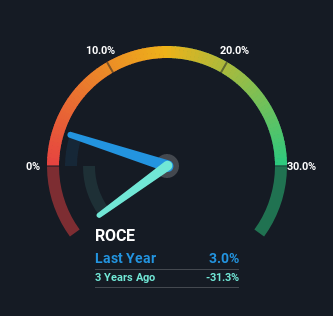
Historical performance is a great place to start when researching a stock so above you can see the gauge for Cathedra Bitcoin's ROCE against it's prior returns. If you want to delve into the historical earnings, revenue and cash flow of Cathedra Bitcoin, check out these free graphs here.
What The Trend Of ROCE Can Tell Us
Cathedra Bitcoin has recently broken into profitability so their prior investments seem to be paying off. Shareholders would no doubt be pleased with this because the business was loss-making four years ago but is is now generating 3.0% on its capital. And unsurprisingly, like most companies trying to break into the black, Cathedra Bitcoin is utilizing 397,635% more capital than it was four years ago. This can indicate that there's plenty of opportunities to invest capital internally and at ever higher rates, both common traits of a multi-bagger.
On a related note, the company's ratio of current liabilities to total assets has decreased to 7.9%, which basically reduces it's funding from the likes of short-term creditors or suppliers. So this improvement in ROCE has come from the business' underlying economics, which is great to see.
What We Can Learn From Cathedra Bitcoin's ROCE
To the delight of most shareholders, Cathedra Bitcoin has now broken into profitability. Since the stock has returned a staggering 141% to shareholders over the last three years, it looks like investors are recognizing these changes. So given the stock has proven it has promising trends, it's worth researching the company further to see if these trends are likely to persist.
Cathedra Bitcoin does come with some risks though, we found 5 warning signs in our investment analysis, and 1 of those is a bit unpleasant...
If you want to search for solid companies with great earnings, check out this free list of companies with good balance sheets and impressive returns on equity.
Have feedback on this article? Concerned about the content? Get in touch with us directly. Alternatively, email editorial-team (at) simplywallst.com.
This article by Simply Wall St is general in nature. We provide commentary based on historical data and analyst forecasts only using an unbiased methodology and our articles are not intended to be financial advice. It does not constitute a recommendation to buy or sell any stock, and does not take account of your objectives, or your financial situation. We aim to bring you long-term focused analysis driven by fundamental data. Note that our analysis may not factor in the latest price-sensitive company announcements or qualitative material. Simply Wall St has no position in any stocks mentioned.
