
 Yahoo Finance
 Carpenter Technology (CRS) Earnings Beat Estimates in Q2
Carpenter Technology CRS reported adjusted earnings of 13 cents per share in second-quarter fiscal 2023, beating the Zacks Consensus Estimate of 12 cents. The company had reported an adjusted loss per share of 58 cents in the year-ago quarter.
Including one-time items, the company posted earnings per share of 13 cents against the year-ago quarter’s loss of 61 cents per share.
Net sales increased 46.2% year over year to $579 million in the reported quarter. The figure topped the Zacks Consensus Estimate of $545 million. The upside was driven by ongoing solid demand in most of the company’s end-use markets.
The company witnessed a year-over-year revenue increase of 49.6% in the Aerospace and Defense end-use market. Revenues in the Energy end-market were up 41.3% year over year. Revenues in the Medical end-use markets increased 55.2% year over year. Revenues in the Distribution markets decreased 1.4%, whereas the same for industrial and consumer end-use markets increased 18.4%. The transportation end-use market sales declined 4.2% year over year.
Operational Results
The cost of goods sold in second-quarter fiscal 2023 moved up 33% year over year to $509 million. The gross profit surged 434.4% year over year to $70 million. The adjusted operating income in the reported quarter was $22.6 million against the prior-year quarter’s operating loss of $29.8 million.
Carpenter Technology Corporation Price, Consensus and EPS Surprise
Carpenter Technology Corporation price-consensus-eps-surprise-chart | Carpenter Technology Corporation Quote
Segmental Performance
The Specialty Alloys Operations segment reported sales of $496 million compared with the prior-year quarter’s $331 million. The segment sold 49,442 pounds compared with the year-ago quarter’s 43,248 pounds. It posted an operating profit of $30.3 million against the operating loss of $20.3 million in the prior-year quarter.
The Performance Engineered Products’ net sales increased 24.5% year over year to $107 million. The segment sold 2,978 pounds, up 7.3% from the year-ago quarter’s figure. The segment reported an operating profit of $9.3 million compared with the prior-year quarter’s operating profit of $3 million.
Financials
Carpenter Technology ended the second quarter of fiscal 2023 with cash and cash equivalents of $20 million compared with $97 million at the end of fiscal 2022. The long-term debt was $692.4 million at the end of the quarter compared with $691.8 as of the end of fiscal 2022. Cash used in operating activities was $86 million in the quarter under review compared with $89 million in the prior-year quarter.
Backed by strong demand across each of its end-use markets and operational improvements, CRS expects accelerating sales momentum and improved margins in the forthcoming quarters.
Price Performance
Carpenter Technology’s shares have gained 63.2% in the past year compared with the industry’s growth of 65%.
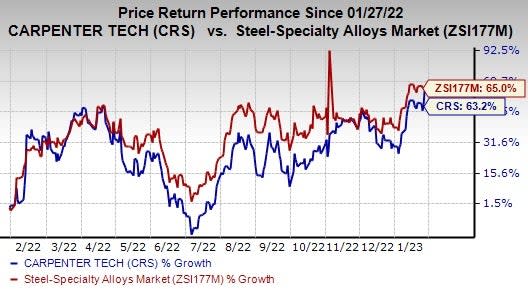
Image Source: Zacks Investment Research
Zacks Rank & Stocks to Consider
Carpenter Technology currently carries a Zacks Rank #3 (Hold).
Some better-ranked stocks in the basic materials space are CalMaine Foods, Inc. CALM, Reliance Steel & Aluminum Co. RS and Air Products and Chemicals, Inc. APD. CALM and RS currently flaunt a Zacks Rank #1 (Strong Buy), and APD carries a Zacks Rank #2 (Buy). You can see the complete list of today’s Zacks #1 Rank stocks here.
The Zacks Consensus Estimate for CalMaine Foods’ fiscal 2023 earnings per share is pegged at $14.08, suggesting 417.7% growth from the year-ago reported figure. Earnings estimates have moved 73.8% north in the past 60 days. CALM has a trailing four-quarter earnings surprise of 15.3%, on average. Its shares have gained 31.4% in the past year.
The Zacks Consensus Estimate for Reliance Steel’s earnings per share is pegged at $28.65 for 2022, indicating a year-over-year growth rate of 29.5%. Earnings estimates have been revised 0.2% upward in the past 60 days. RS has a trailing four-quarter average surprise of 13.6%, on average. The company has gained 26.7% in a year.
The Zacks Consensus Estimate for Air Products’ 2023 earnings per share is pegged at $11.42, suggesting 9.7% growth from the year-ago reported figure. Earnings estimates have been unchanged in the past 60 days. APD has a trailing four-quarter earnings surprise of 1.7%, on average. Its shares have gained 14.7% in the past year.
Want the latest recommendations from Zacks Investment Research? Today, you can download 7 Best Stocks for the Next 30 Days. Click to get this free report
Air Products and Chemicals, Inc. (APD) : Free Stock Analysis Report
Reliance Steel & Aluminum Co. (RS) : Free Stock Analysis Report
Cal-Maine Foods, Inc. (CALM) : Free Stock Analysis Report
Carpenter Technology Corporation (CRS) : Free Stock Analysis Report
