
 Yahoo Finance
 CarParts.com (NASDAQ:PRTS) Is Reinvesting At Lower Rates Of Return
If we want to find a potential multi-bagger, often there are underlying trends that can provide clues. One common approach is to try and find a company with returns on capital employed (ROCE) that are increasing, in conjunction with a growing amount of capital employed. Put simply, these types of businesses are compounding machines, meaning they are continually reinvesting their earnings at ever-higher rates of return. Having said that, from a first glance at CarParts.com (NASDAQ:PRTS) we aren't jumping out of our chairs at how returns are trending, but let's have a deeper look.
Understanding Return On Capital Employed (ROCE)
Just to clarify if you're unsure, ROCE is a metric for evaluating how much pre-tax income (in percentage terms) a company earns on the capital invested in its business. To calculate this metric for CarParts.com, this is the formula:
Return on Capital Employed = Earnings Before Interest and Tax (EBIT) ÷ (Total Assets - Current Liabilities)
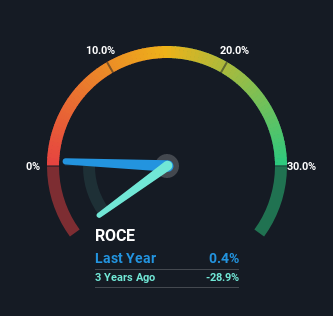
0.0043 = US$651k ÷ (US$238m - US$88m) (Based on the trailing twelve months to December 2022).
Therefore, CarParts.com has an ROCE of 0.4%. Ultimately, that's a low return and it under-performs the Specialty Retail industry average of 13%.
See our latest analysis for CarParts.com
In the above chart we have measured CarParts.com's prior ROCE against its prior performance, but the future is arguably more important. If you're interested, you can view the analysts predictions in our free report on analyst forecasts for the company.
What Does the ROCE Trend For CarParts.com Tell Us?
In terms of CarParts.com's historical ROCE movements, the trend isn't fantastic. To be more specific, ROCE has fallen from 8.9% over the last five years. Although, given both revenue and the amount of assets employed in the business have increased, it could suggest the company is investing in growth, and the extra capital has led to a short-term reduction in ROCE. If these investments prove successful, this can bode very well for long term stock performance.
On a side note, CarParts.com has done well to pay down its current liabilities to 37% of total assets. So we could link some of this to the decrease in ROCE. Effectively this means their suppliers or short-term creditors are funding less of the business, which reduces some elements of risk. Some would claim this reduces the business' efficiency at generating ROCE since it is now funding more of the operations with its own money.
What We Can Learn From CarParts.com's ROCE
While returns have fallen for CarParts.com in recent times, we're encouraged to see that sales are growing and that the business is reinvesting in its operations. And long term investors must be optimistic going forward because the stock has returned a huge 151% to shareholders in the last five years. So while investors seem to be recognizing these promising trends, we would look further into this stock to make sure the other metrics justify the positive view.
On a separate note, we've found 2 warning signs for CarParts.com you'll probably want to know about.
While CarParts.com may not currently earn the highest returns, we've compiled a list of companies that currently earn more than 25% return on equity. Check out this free list here.
Have feedback on this article? Concerned about the content? Get in touch with us directly. Alternatively, email editorial-team (at) simplywallst.com.
This article by Simply Wall St is general in nature. We provide commentary based on historical data and analyst forecasts only using an unbiased methodology and our articles are not intended to be financial advice. It does not constitute a recommendation to buy or sell any stock, and does not take account of your objectives, or your financial situation. We aim to bring you long-term focused analysis driven by fundamental data. Note that our analysis may not factor in the latest price-sensitive company announcements or qualitative material. Simply Wall St has no position in any stocks mentioned.
Join A Paid User Research Session
You’ll receive a US$30 Amazon Gift card for 1 hour of your time while helping us build better investing tools for the individual investors like yourself. Sign up here
