
 Yahoo Finance
 Capstone Copper Corp.'s (TSE:CS) Business Is Trailing The Market But Its Shares Aren't
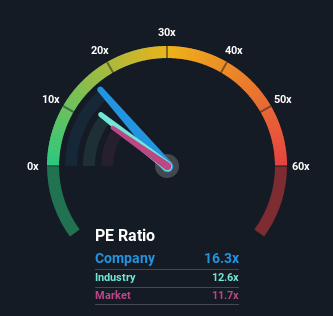
With a price-to-earnings (or "P/E") ratio of 16.3x Capstone Copper Corp. (TSE:CS) may be sending bearish signals at the moment, given that almost half of all companies in Canada have P/E ratios under 11x and even P/E's lower than 5x are not unusual. Although, it's not wise to just take the P/E at face value as there may be an explanation why it's lofty.
Capstone Copper could be doing better as it's been growing earnings less than most other companies lately. It might be that many expect the uninspiring earnings performance to recover significantly, which has kept the P/E from collapsing. You'd really hope so, otherwise you're paying a pretty hefty price for no particular reason.
View our latest analysis for Capstone Copper
Want the full picture on analyst estimates for the company? Then our free report on Capstone Copper will help you uncover what's on the horizon.
Is There Enough Growth For Capstone Copper?
The only time you'd be truly comfortable seeing a P/E as high as Capstone Copper's is when the company's growth is on track to outshine the market.
If we review the last year of earnings growth, the company posted a worthy increase of 13%. Pleasingly, EPS has also lifted 813% in aggregate from three years ago, partly thanks to the last 12 months of growth. Accordingly, shareholders would have probably welcomed those medium-term rates of earnings growth.
Turning to the outlook, the next three years should generate growth of 14% each year as estimated by the six analysts watching the company. That's shaping up to be similar to the 14% per annum growth forecast for the broader market.
With this information, we find it interesting that Capstone Copper is trading at a high P/E compared to the market. Apparently many investors in the company are more bullish than analysts indicate and aren't willing to let go of their stock right now. These shareholders may be setting themselves up for disappointment if the P/E falls to levels more in line with the growth outlook.
The Bottom Line On Capstone Copper's P/E
We'd say the price-to-earnings ratio's power isn't primarily as a valuation instrument but rather to gauge current investor sentiment and future expectations.
Our examination of Capstone Copper's analyst forecasts revealed that its market-matching earnings outlook isn't impacting its high P/E as much as we would have predicted. Right now we are uncomfortable with the relatively high share price as the predicted future earnings aren't likely to support such positive sentiment for long. Unless these conditions improve, it's challenging to accept these prices as being reasonable.
You should always think about risks. Case in point, we've spotted 3 warning signs for Capstone Copper you should be aware of, and 1 of them doesn't sit too well with us.
If you're unsure about the strength of Capstone Copper's business, why not explore our interactive list of stocks with solid business fundamentals for some other companies you may have missed.
Have feedback on this article? Concerned about the content? Get in touch with us directly. Alternatively, email editorial-team (at) simplywallst.com.
This article by Simply Wall St is general in nature. We provide commentary based on historical data and analyst forecasts only using an unbiased methodology and our articles are not intended to be financial advice. It does not constitute a recommendation to buy or sell any stock, and does not take account of your objectives, or your financial situation. We aim to bring you long-term focused analysis driven by fundamental data. Note that our analysis may not factor in the latest price-sensitive company announcements or qualitative material. Simply Wall St has no position in any stocks mentioned.
