
 Yahoo Finance
 What Is Capri Holdings's (NYSE:CPRI) P/E Ratio After Its Share Price Tanked?

To the annoyance of some shareholders, Capri Holdings (NYSE:CPRI) shares are down a considerable 31% in the last month. That drop has capped off a tough year for shareholders, with the share price down 54% in that time.
All else being equal, a share price drop should make a stock more attractive to potential investors. While the market sentiment towards a stock is very changeable, in the long run, the share price will tend to move in the same direction as earnings per share. So, on certain occasions, long term focussed investors try to take advantage of pessimistic expectations to buy shares at a better price. Perhaps the simplest way to get a read on investors' expectations of a business is to look at its Price to Earnings Ratio (PE Ratio). Investors have optimistic expectations of companies with higher P/E ratios, compared to companies with lower P/E ratios.
View our latest analysis for Capri Holdings
How Does Capri Holdings's P/E Ratio Compare To Its Peers?
Capri Holdings's P/E of 9.22 indicates relatively low sentiment towards the stock. If you look at the image below, you can see Capri Holdings has a lower P/E than the average (13.8) in the luxury industry classification.
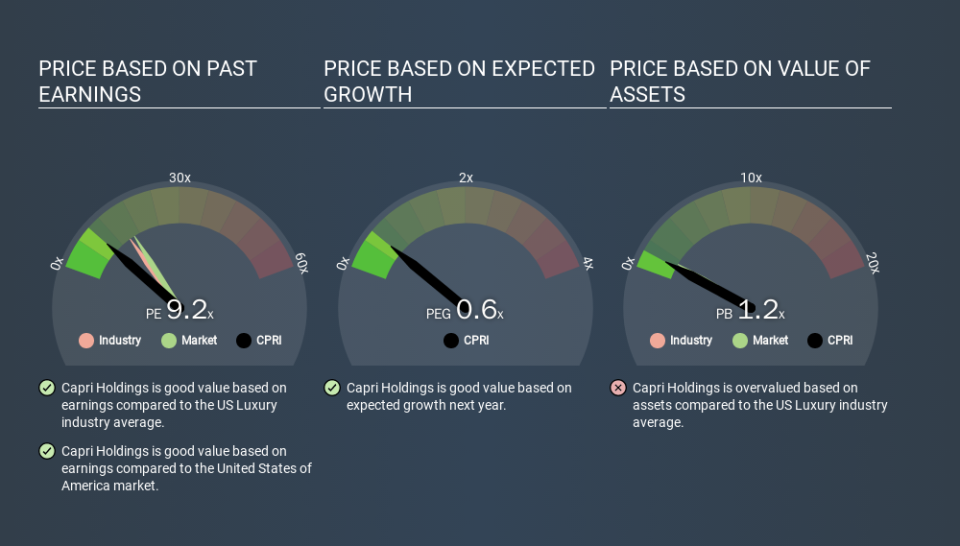
Its relatively low P/E ratio indicates that Capri Holdings shareholders think it will struggle to do as well as other companies in its industry classification. Since the market seems unimpressed with Capri Holdings, it's quite possible it could surprise on the upside. If you consider the stock interesting, further research is recommended. For example, I often monitor director buying and selling.
How Growth Rates Impact P/E Ratios
If earnings fall then in the future the 'E' will be lower. That means even if the current P/E is low, it will increase over time if the share price stays flat. So while a stock may look cheap based on past earnings, it could be expensive based on future earnings.
Capri Holdings saw earnings per share decrease by 39% last year. And over the longer term (5 years) earnings per share have decreased 11% annually. This could justify a pessimistic P/E.
Remember: P/E Ratios Don't Consider The Balance Sheet
One drawback of using a P/E ratio is that it considers market capitalization, but not the balance sheet. In other words, it does not consider any debt or cash that the company may have on the balance sheet. Theoretically, a business can improve its earnings (and produce a lower P/E in the future) by investing in growth. That means taking on debt (or spending its cash).
Such spending might be good or bad, overall, but the key point here is that you need to look at debt to understand the P/E ratio in context.
Capri Holdings's Balance Sheet
Capri Holdings has net debt worth 62% of its market capitalization. This is a reasonably significant level of debt -- all else being equal you'd expect a much lower P/E than if it had net cash.
The Verdict On Capri Holdings's P/E Ratio
Capri Holdings trades on a P/E ratio of 9.2, which is below the US market average of 15.1. When you consider that the company has significant debt, and didn't grow EPS last year, it isn't surprising that the market has muted expectations. Given Capri Holdings's P/E ratio has declined from 13.3 to 9.2 in the last month, we know for sure that the market is more worried about the business today, than it was back then. For those who prefer to invest with the flow of momentum, that might be a bad sign, but for deep value investors this stock might justify some research.
When the market is wrong about a stock, it gives savvy investors an opportunity. As value investor Benjamin Graham famously said, 'In the short run, the market is a voting machine but in the long run, it is a weighing machine. So this free visualization of the analyst consensus on future earnings could help you make the right decision about whether to buy, sell, or hold.
Of course you might be able to find a better stock than Capri Holdings. So you may wish to see this free collection of other companies that have grown earnings strongly.
If you spot an error that warrants correction, please contact the editor at editorial-team@simplywallst.com. This article by Simply Wall St is general in nature. It does not constitute a recommendation to buy or sell any stock, and does not take account of your objectives, or your financial situation. Simply Wall St has no position in the stocks mentioned.
We aim to bring you long-term focused research analysis driven by fundamental data. Note that our analysis may not factor in the latest price-sensitive company announcements or qualitative material. Thank you for reading.
