
 Yahoo Finance
 Capital Allocation Trends At Tractor Supply (NASDAQ:TSCO) Aren't Ideal
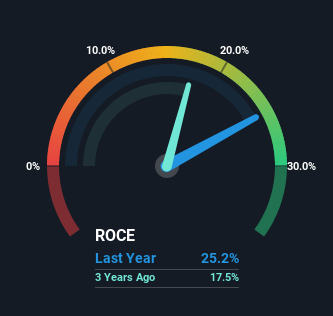
Finding a business that has the potential to grow substantially is not easy, but it is possible if we look at a few key financial metrics. In a perfect world, we'd like to see a company investing more capital into its business and ideally the returns earned from that capital are also increasing. If you see this, it typically means it's a company with a great business model and plenty of profitable reinvestment opportunities. Looking at Tractor Supply (NASDAQ:TSCO), it does have a high ROCE right now, but lets see how returns are trending.
Understanding Return On Capital Employed (ROCE)
For those that aren't sure what ROCE is, it measures the amount of pre-tax profits a company can generate from the capital employed in its business. To calculate this metric for Tractor Supply, this is the formula:
Return on Capital Employed = Earnings Before Interest and Tax (EBIT) ÷ (Total Assets - Current Liabilities)
0.25 = US$1.4b ÷ (US$7.7b - US$2.2b) (Based on the trailing twelve months to March 2022).
Thus, Tractor Supply has an ROCE of 25%. In absolute terms that's a great return and it's even better than the Specialty Retail industry average of 18%.
See our latest analysis for Tractor Supply
In the above chart we have measured Tractor Supply's prior ROCE against its prior performance, but the future is arguably more important. If you'd like, you can check out the forecasts from the analysts covering Tractor Supply here for free.
What Can We Tell From Tractor Supply's ROCE Trend?
In terms of Tractor Supply's historical ROCE movements, the trend isn't fantastic. While it's comforting that the ROCE is high, five years ago it was 32%. Although, given both revenue and the amount of assets employed in the business have increased, it could suggest the company is investing in growth, and the extra capital has led to a short-term reduction in ROCE. If these investments prove successful, this can bode very well for long term stock performance.
In Conclusion...
While returns have fallen for Tractor Supply in recent times, we're encouraged to see that sales are growing and that the business is reinvesting in its operations. And the stock has done incredibly well with a 246% return over the last five years, so long term investors are no doubt ecstatic with that result. So while investors seem to be recognizing these promising trends, we would look further into this stock to make sure the other metrics justify the positive view.
Tractor Supply does come with some risks though, we found 4 warning signs in our investment analysis, and 1 of those shouldn't be ignored...
Tractor Supply is not the only stock earning high returns. If you'd like to see more, check out our free list of companies earning high returns on equity with solid fundamentals.
Have feedback on this article? Concerned about the content? Get in touch with us directly. Alternatively, email editorial-team (at) simplywallst.com.
This article by Simply Wall St is general in nature. We provide commentary based on historical data and analyst forecasts only using an unbiased methodology and our articles are not intended to be financial advice. It does not constitute a recommendation to buy or sell any stock, and does not take account of your objectives, or your financial situation. We aim to bring you long-term focused analysis driven by fundamental data. Note that our analysis may not factor in the latest price-sensitive company announcements or qualitative material. Simply Wall St has no position in any stocks mentioned.
