
 Yahoo Finance
 Capital Allocation Trends At Reko International Group (CVE:REKO) Aren't Ideal
What financial metrics can indicate to us that a company is maturing or even in decline? Typically, we'll see the trend of both return on capital employed (ROCE) declining and this usually coincides with a decreasing amount of capital employed. This combination can tell you that not only is the company investing less, it's earning less on what it does invest. In light of that, from a first glance at Reko International Group (CVE:REKO), we've spotted some signs that it could be struggling, so let's investigate.
Understanding Return On Capital Employed (ROCE)
For those that aren't sure what ROCE is, it measures the amount of pre-tax profits a company can generate from the capital employed in its business. To calculate this metric for Reko International Group, this is the formula:
Return on Capital Employed = Earnings Before Interest and Tax (EBIT) ÷ (Total Assets - Current Liabilities)
0.043 = CA$2.1m ÷ (CA$63m - CA$14m) (Based on the trailing twelve months to January 2023).
Thus, Reko International Group has an ROCE of 4.3%. On its own, that's a low figure but it's around the 5.3% average generated by the Machinery industry.
View our latest analysis for Reko International Group
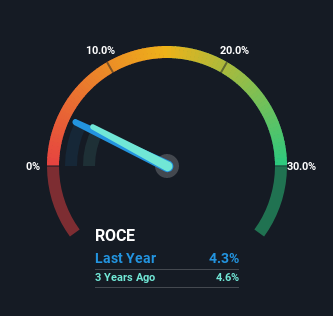
Historical performance is a great place to start when researching a stock so above you can see the gauge for Reko International Group's ROCE against it's prior returns. If you'd like to look at how Reko International Group has performed in the past in other metrics, you can view this free graph of past earnings, revenue and cash flow.
The Trend Of ROCE
In terms of Reko International Group's historical ROCE movements, the trend doesn't inspire confidence. To be more specific, the ROCE was 5.6% five years ago, but since then it has dropped noticeably. Meanwhile, capital employed in the business has stayed roughly the flat over the period. Companies that exhibit these attributes tend to not be shrinking, but they can be mature and facing pressure on their margins from competition. So because these trends aren't typically conducive to creating a multi-bagger, we wouldn't hold our breath on Reko International Group becoming one if things continue as they have.
The Bottom Line On Reko International Group's ROCE
In the end, the trend of lower returns on the same amount of capital isn't typically an indication that we're looking at a growth stock. Yet despite these concerning fundamentals, the stock has performed strongly with a 63% return over the last five years, so investors appear very optimistic. In any case, the current underlying trends don't bode well for long term performance so unless they reverse, we'd start looking elsewhere.
On a final note, we found 3 warning signs for Reko International Group (1 is a bit concerning) you should be aware of.
While Reko International Group isn't earning the highest return, check out this free list of companies that are earning high returns on equity with solid balance sheets.
Have feedback on this article? Concerned about the content? Get in touch with us directly. Alternatively, email editorial-team (at) simplywallst.com.
This article by Simply Wall St is general in nature. We provide commentary based on historical data and analyst forecasts only using an unbiased methodology and our articles are not intended to be financial advice. It does not constitute a recommendation to buy or sell any stock, and does not take account of your objectives, or your financial situation. We aim to bring you long-term focused analysis driven by fundamental data. Note that our analysis may not factor in the latest price-sensitive company announcements or qualitative material. Simply Wall St has no position in any stocks mentioned.
Join A Paid User Research Session
You’ll receive a US$30 Amazon Gift card for 1 hour of your time while helping us build better investing tools for the individual investors like yourself. Sign up here
