
 Yahoo Finance
 Capital Allocation Trends At Miller Industries (NYSE:MLR) Aren't Ideal
If we want to find a potential multi-bagger, often there are underlying trends that can provide clues. Typically, we'll want to notice a trend of growing return on capital employed (ROCE) and alongside that, an expanding base of capital employed. Basically this means that a company has profitable initiatives that it can continue to reinvest in, which is a trait of a compounding machine. In light of that, when we looked at Miller Industries (NYSE:MLR) and its ROCE trend, we weren't exactly thrilled.
Return On Capital Employed (ROCE): What is it?
For those who don't know, ROCE is a measure of a company's yearly pre-tax profit (its return), relative to the capital employed in the business. Analysts use this formula to calculate it for Miller Industries:
Return on Capital Employed = Earnings Before Interest and Tax (EBIT) ÷ (Total Assets - Current Liabilities)
0.08 = US$24m ÷ (US$439m - US$144m) (Based on the trailing twelve months to December 2021).
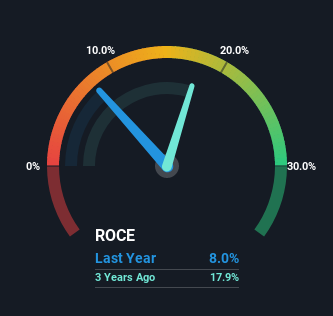
Therefore, Miller Industries has an ROCE of 8.0%. Ultimately, that's a low return and it under-performs the Machinery industry average of 10%.
Check out our latest analysis for Miller Industries
While the past is not representative of the future, it can be helpful to know how a company has performed historically, which is why we have this chart above. If you'd like to look at how Miller Industries has performed in the past in other metrics, you can view this free graph of past earnings, revenue and cash flow.
So How Is Miller Industries' ROCE Trending?
In terms of Miller Industries' historical ROCE movements, the trend isn't fantastic. To be more specific, ROCE has fallen from 17% over the last five years. However, given capital employed and revenue have both increased it appears that the business is currently pursuing growth, at the consequence of short term returns. And if the increased capital generates additional returns, the business, and thus shareholders, will benefit in the long run.
What We Can Learn From Miller Industries' ROCE
Even though returns on capital have fallen in the short term, we find it promising that revenue and capital employed have both increased for Miller Industries. These trends are starting to be recognized by investors since the stock has delivered a 22% gain to shareholders who've held over the last five years. Therefore we'd recommend looking further into this stock to confirm if it has the makings of a good investment.
One more thing to note, we've identified 2 warning signs with Miller Industries and understanding these should be part of your investment process.
While Miller Industries isn't earning the highest return, check out this free list of companies that are earning high returns on equity with solid balance sheets.
Have feedback on this article? Concerned about the content? Get in touch with us directly. Alternatively, email editorial-team (at) simplywallst.com.
This article by Simply Wall St is general in nature. We provide commentary based on historical data and analyst forecasts only using an unbiased methodology and our articles are not intended to be financial advice. It does not constitute a recommendation to buy or sell any stock, and does not take account of your objectives, or your financial situation. We aim to bring you long-term focused analysis driven by fundamental data. Note that our analysis may not factor in the latest price-sensitive company announcements or qualitative material. Simply Wall St has no position in any stocks mentioned.
