
 Yahoo Finance
 Capital Allocation Trends At Canada Goose Holdings (TSE:GOOS) Aren't Ideal
Did you know there are some financial metrics that can provide clues of a potential multi-bagger? Amongst other things, we'll want to see two things; firstly, a growing return on capital employed (ROCE) and secondly, an expansion in the company's amount of capital employed. Basically this means that a company has profitable initiatives that it can continue to reinvest in, which is a trait of a compounding machine. Although, when we looked at Canada Goose Holdings (TSE:GOOS), it didn't seem to tick all of these boxes.
What Is Return On Capital Employed (ROCE)?
For those who don't know, ROCE is a measure of a company's yearly pre-tax profit (its return), relative to the capital employed in the business. The formula for this calculation on Canada Goose Holdings is:
Return on Capital Employed = Earnings Before Interest and Tax (EBIT) ÷ (Total Assets - Current Liabilities)
0.11 = CA$131m ÷ (CA$1.7b - CA$459m) (Based on the trailing twelve months to January 2023).
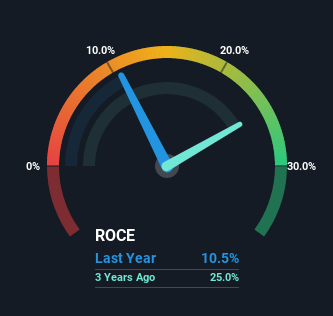
Thus, Canada Goose Holdings has an ROCE of 11%. In absolute terms, that's a pretty standard return but compared to the Luxury industry average it falls behind.
View our latest analysis for Canada Goose Holdings
Above you can see how the current ROCE for Canada Goose Holdings compares to its prior returns on capital, but there's only so much you can tell from the past. If you'd like, you can check out the forecasts from the analysts covering Canada Goose Holdings here for free.
So How Is Canada Goose Holdings' ROCE Trending?
On the surface, the trend of ROCE at Canada Goose Holdings doesn't inspire confidence. Over the last five years, returns on capital have decreased to 11% from 24% five years ago. However it looks like Canada Goose Holdings might be reinvesting for long term growth because while capital employed has increased, the company's sales haven't changed much in the last 12 months. It's worth keeping an eye on the company's earnings from here on to see if these investments do end up contributing to the bottom line.
In Conclusion...
Bringing it all together, while we're somewhat encouraged by Canada Goose Holdings' reinvestment in its own business, we're aware that returns are shrinking. And in the last five years, the stock has given away 40% so the market doesn't look too hopeful on these trends strengthening any time soon. On the whole, we aren't too inspired by the underlying trends and we think there may be better chances of finding a multi-bagger elsewhere.
Like most companies, Canada Goose Holdings does come with some risks, and we've found 1 warning sign that you should be aware of.
While Canada Goose Holdings may not currently earn the highest returns, we've compiled a list of companies that currently earn more than 25% return on equity. Check out this free list here.
Have feedback on this article? Concerned about the content? Get in touch with us directly. Alternatively, email editorial-team (at) simplywallst.com.
This article by Simply Wall St is general in nature. We provide commentary based on historical data and analyst forecasts only using an unbiased methodology and our articles are not intended to be financial advice. It does not constitute a recommendation to buy or sell any stock, and does not take account of your objectives, or your financial situation. We aim to bring you long-term focused analysis driven by fundamental data. Note that our analysis may not factor in the latest price-sensitive company announcements or qualitative material. Simply Wall St has no position in any stocks mentioned.
Join A Paid User Research Session
You’ll receive a US$30 Amazon Gift card for 1 hour of your time while helping us build better investing tools for the individual investors like yourself. Sign up here
