
 Yahoo Finance
 Capital Allocation Trends At C-Com Satellite Systems (CVE:CMI) Aren't Ideal
If we want to find a potential multi-bagger, often there are underlying trends that can provide clues. Typically, we'll want to notice a trend of growing return on capital employed (ROCE) and alongside that, an expanding base of capital employed. Basically this means that a company has profitable initiatives that it can continue to reinvest in, which is a trait of a compounding machine. However, after briefly looking over the numbers, we don't think C-Com Satellite Systems (CVE:CMI) has the makings of a multi-bagger going forward, but let's have a look at why that may be.
What is Return On Capital Employed (ROCE)?
If you haven't worked with ROCE before, it measures the 'return' (pre-tax profit) a company generates from capital employed in its business. The formula for this calculation on C-Com Satellite Systems is:
Return on Capital Employed = Earnings Before Interest and Tax (EBIT) ÷ (Total Assets - Current Liabilities)
0.0049 = CA$125k ÷ (CA$27m - CA$1.4m) (Based on the trailing twelve months to May 2022).
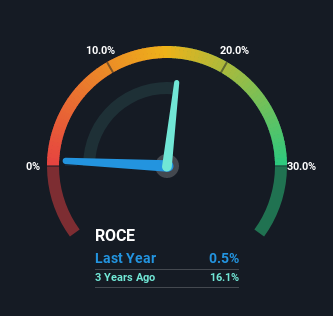
Therefore, C-Com Satellite Systems has an ROCE of 0.5%. Ultimately, that's a low return and it under-performs the Communications industry average of 5.2%.
View our latest analysis for C-Com Satellite Systems
While the past is not representative of the future, it can be helpful to know how a company has performed historically, which is why we have this chart above. If you want to delve into the historical earnings, revenue and cash flow of C-Com Satellite Systems, check out these free graphs here.
So How Is C-Com Satellite Systems' ROCE Trending?
On the surface, the trend of ROCE at C-Com Satellite Systems doesn't inspire confidence. Around five years ago the returns on capital were 5.6%, but since then they've fallen to 0.5%. Meanwhile, the business is utilizing more capital but this hasn't moved the needle much in terms of sales in the past 12 months, so this could reflect longer term investments. It's worth keeping an eye on the company's earnings from here on to see if these investments do end up contributing to the bottom line.
The Bottom Line
To conclude, we've found that C-Com Satellite Systems is reinvesting in the business, but returns have been falling. Yet to long term shareholders the stock has gifted them an incredible 112% return in the last five years, so the market appears to be rosy about its future. However, unless these underlying trends turn more positive, we wouldn't get our hopes up too high.
If you'd like to know more about C-Com Satellite Systems, we've spotted 7 warning signs, and 2 of them are a bit concerning.
While C-Com Satellite Systems may not currently earn the highest returns, we've compiled a list of companies that currently earn more than 25% return on equity. Check out this free list here.
Have feedback on this article? Concerned about the content? Get in touch with us directly. Alternatively, email editorial-team (at) simplywallst.com.
This article by Simply Wall St is general in nature. We provide commentary based on historical data and analyst forecasts only using an unbiased methodology and our articles are not intended to be financial advice. It does not constitute a recommendation to buy or sell any stock, and does not take account of your objectives, or your financial situation. We aim to bring you long-term focused analysis driven by fundamental data. Note that our analysis may not factor in the latest price-sensitive company announcements or qualitative material. Simply Wall St has no position in any stocks mentioned.
Join A Paid User Research Session
You’ll receive a US$30 Amazon Gift card for 1 hour of your time while helping us build better investing tools for the individual investors like yourself. Sign up here
