
 Yahoo Finance
 Canacol Energy (TSE:CNE) shareholders have endured a 2.6% loss from investing in the stock five years ago
While it may not be enough for some shareholders, we think it is good to see the Canacol Energy Ltd (TSE:CNE) share price up 24% in a single quarter. But over the last half decade, the stock has not performed well. In fact, the share price is down 13%, which falls well short of the return you could get by buying an index fund.
With that in mind, it's worth seeing if the company's underlying fundamentals have been the driver of long term performance, or if there are some discrepancies.
Check out our latest analysis for Canacol Energy
While the efficient markets hypothesis continues to be taught by some, it has been proven that markets are over-reactive dynamic systems, and investors are not always rational. By comparing earnings per share (EPS) and share price changes over time, we can get a feel for how investor attitudes to a company have morphed over time.
Canacol Energy became profitable within the last five years. That would generally be considered a positive, so we are surprised to see the share price is down. Other metrics may better explain the share price move.
The steady dividend doesn't really explain why the share price is down. It's not immediately clear to us why the stock price is down but further research might provide some answers.
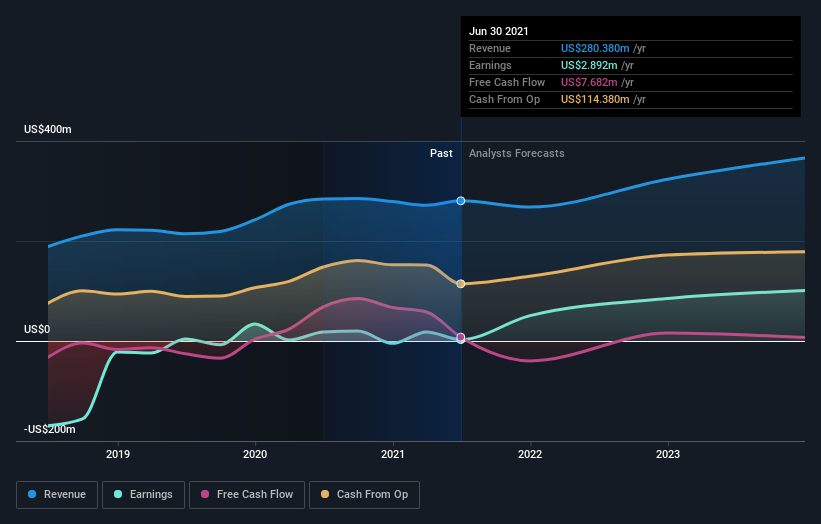
The image below shows how earnings and revenue have tracked over time (if you click on the image you can see greater detail).
We know that Canacol Energy has improved its bottom line over the last three years, but what does the future have in store? If you are thinking of buying or selling Canacol Energy stock, you should check out this FREE detailed report on its balance sheet.
What About Dividends?
When looking at investment returns, it is important to consider the difference between total shareholder return (TSR) and share price return. Whereas the share price return only reflects the change in the share price, the TSR includes the value of dividends (assuming they were reinvested) and the benefit of any discounted capital raising or spin-off. It's fair to say that the TSR gives a more complete picture for stocks that pay a dividend. We note that for Canacol Energy the TSR over the last 5 years was -2.6%, which is better than the share price return mentioned above. This is largely a result of its dividend payments!
A Different Perspective
Canacol Energy shareholders gained a total return of 19% during the year. But that was short of the market average. But at least that's still a gain! Over five years the TSR has been a reduction of 0.5% per year, over five years. It could well be that the business is stabilizing. It's always interesting to track share price performance over the longer term. But to understand Canacol Energy better, we need to consider many other factors. To that end, you should learn about the 4 warning signs we've spotted with Canacol Energy (including 1 which is potentially serious) .
For those who like to find winning investments this free list of growing companies with recent insider purchasing, could be just the ticket.
Please note, the market returns quoted in this article reflect the market weighted average returns of stocks that currently trade on CA exchanges.
This article by Simply Wall St is general in nature. We provide commentary based on historical data and analyst forecasts only using an unbiased methodology and our articles are not intended to be financial advice. It does not constitute a recommendation to buy or sell any stock, and does not take account of your objectives, or your financial situation. We aim to bring you long-term focused analysis driven by fundamental data. Note that our analysis may not factor in the latest price-sensitive company announcements or qualitative material. Simply Wall St has no position in any stocks mentioned.
Have feedback on this article? Concerned about the content? Get in touch with us directly. Alternatively, email editorial-team (at) simplywallst.com.
