
 Yahoo Finance
 Should Calian Group Ltd. (TSE:CGY) Be Part Of Your Dividend Portfolio?

Is Calian Group Ltd. (TSE:CGY) a good dividend stock? How can we tell? Dividend paying companies with growing earnings can be highly rewarding in the long term. If you are hoping to live on your dividends, it's important to be more stringent with your investments than the average punter. Regular readers know we like to apply the same approach to each dividend stock, and we hope you'll find our analysis useful.
A 2.9% yield is nothing to get excited about, but investors probably think the long payment history suggests Calian Group has some staying power. Before you buy any stock for its dividend however, you should always remember Warren Buffett's two rules: 1) Don't lose money, and 2) Remember rule #1. We'll run through some checks below to help with this.
Explore this interactive chart for our latest analysis on Calian Group!
Payout ratios
Dividends are typically paid from company earnings. If a company pays more in dividends than it earned, then the dividend might become unsustainable - hardly an ideal situation. As a result, we should always investigate whether a company can afford its dividend, measured as a percentage of a company's net income after tax. Looking at the data, we can see that 44% of Calian Group's profits were paid out as dividends in the last 12 months. This is a middling range that strikes a nice balance between paying dividends to shareholders, and retaining enough earnings to invest in future growth. Plus, there is room to increase the payout ratio over time.
Another important check we do is to see if the free cash flow generated is sufficient to pay the dividend. Calian Group paid out 101% of its free cash last year. Cash flows can be lumpy, but this dividend was not well covered by cash flow. Calian Group paid out less in dividends than it reported in profits, but unfortunately it didn't generate enough free cash flow to cover the dividend. Were it to repeatedly pay dividends that were not well covered by cash flow, this could be a risk to Calian Group's ability to maintain its dividend.
While the above analysis focuses on dividends relative to a company's earnings, we do note Calian Group's strong net cash position, which will let it pay larger dividends for a time, should it choose.
Consider getting our latest analysis on Calian Group's financial position here.
Dividend Volatility
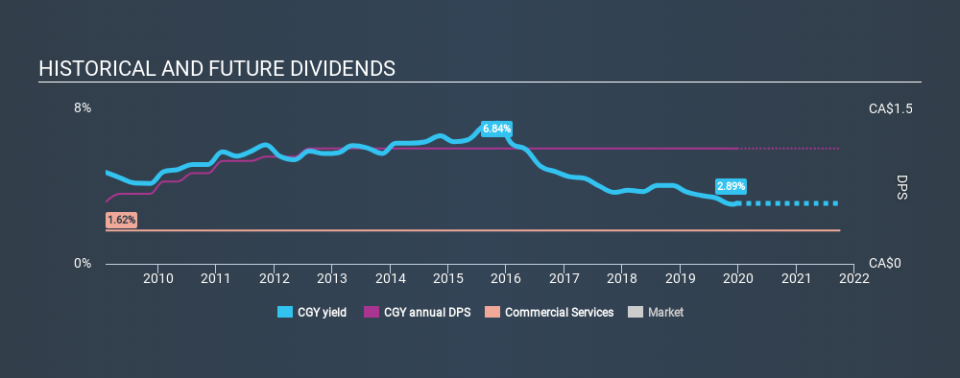
From the perspective of an income investor who wants to earn dividends for many years, there is not much point buying a stock if its dividend is regularly cut or is not reliable. For the purpose of this article, we only scrutinise the last decade of Calian Group's dividend payments. During this period the dividend has been stable, which could imply the business could have relatively consistent earnings power. During the past ten-year period, the first annual payment was CA$0.60 in 2009, compared to CA$1.12 last year. This works out to be a compound annual growth rate (CAGR) of approximately 6.4% a year over that time.
Businesses that can grow their dividends at a decent rate and maintain a stable payout can generate substantial wealth for shareholders over the long term.
Dividend Growth Potential
Dividend payments have been consistent over the past few years, but we should always check if earnings per share (EPS) are growing, as this will help maintain the purchasing power of the dividend. It's good to see Calian Group has been growing its earnings per share at 12% a year over the past five years. A company paying out less than a quarter of its earnings as dividends, and growing earnings at more than 10% per annum, looks to be right in the cusp of its growth phase. At the right price, we might be interested.
We'd also point out that Calian Group issued a meaningful number of new shares in the past year. Trying to grow the dividend when issuing new shares reminds us of the ancient Greek tale of Sisyphus - perpetually pushing a boulder uphill. Companies that consistently issue new shares are often suboptimal from a dividend perspective.
Conclusion
When we look at a dividend stock, we need to form a judgement on whether the dividend will grow, if the company is able to maintain it in a wide range of economic circumstances, and if the dividend payout is sustainable. First, we like Calian Group's low dividend payout ratio, although we're a bit concerned that it paid out a substantially higher percentage of its free cash flow. That said, we were glad to see it growing earnings and paying a fairly consistent dividend. Overall we think Calian Group is an interesting dividend stock, although it could be better.
Earnings growth generally bodes well for the future value of company dividend payments. See if the 3 Calian Group analysts we track are forecasting continued growth with our free report on analyst estimates for the company.
If you are a dividend investor, you might also want to look at our curated list of dividend stocks yielding above 3%.
If you spot an error that warrants correction, please contact the editor at editorial-team@simplywallst.com. This article by Simply Wall St is general in nature. It does not constitute a recommendation to buy or sell any stock, and does not take account of your objectives, or your financial situation. Simply Wall St has no position in the stocks mentioned.
We aim to bring you long-term focused research analysis driven by fundamental data. Note that our analysis may not factor in the latest price-sensitive company announcements or qualitative material. Thank you for reading.
