
 Yahoo Finance
 What Can We Make Of Cactus, Inc.’s (NYSE:WHD) High Return On Capital?

Today we are going to look at Cactus, Inc. (NYSE:WHD) to see whether it might be an attractive investment prospect. Specifically, we'll consider its Return On Capital Employed (ROCE), since that will give us an insight into how efficiently the business can generate profits from the capital it requires.
First up, we'll look at what ROCE is and how we calculate it. Then we'll compare its ROCE to similar companies. Last but not least, we'll look at what impact its current liabilities have on its ROCE.
What is Return On Capital Employed (ROCE)?
ROCE measures the 'return' (pre-tax profit) a company generates from capital employed in its business. All else being equal, a better business will have a higher ROCE. In brief, it is a useful tool, but it is not without drawbacks. Renowned investment researcher Michael Mauboussin has suggested that a high ROCE can indicate that 'one dollar invested in the company generates value of more than one dollar'.
So, How Do We Calculate ROCE?
Analysts use this formula to calculate return on capital employed:
Return on Capital Employed = Earnings Before Interest and Tax (EBIT) ÷ (Total Assets - Current Liabilities)
Or for Cactus:
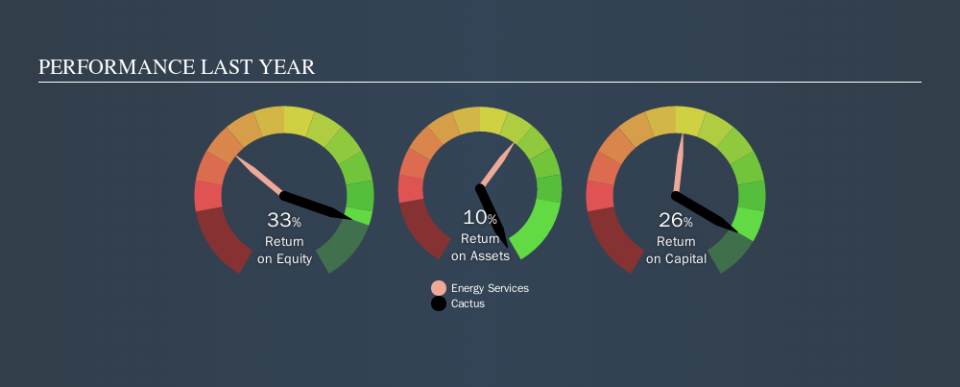
0.26 = US$191m ÷ (US$811m - US$90m) (Based on the trailing twelve months to September 2019.)
Therefore, Cactus has an ROCE of 26%.
Check out our latest analysis for Cactus
Is Cactus's ROCE Good?
When making comparisons between similar businesses, investors may find ROCE useful. In our analysis, Cactus's ROCE is meaningfully higher than the 9.3% average in the Energy Services industry. I think that's good to see, since it implies the company is better than other companies at making the most of its capital. Setting aside the comparison to its industry for a moment, Cactus's ROCE in absolute terms currently looks quite high.
We can see that, Cactus currently has an ROCE of 26% compared to its ROCE 3 years ago, which was 13%. This makes us think about whether the company has been reinvesting shrewdly. You can see in the image below how Cactus's ROCE compares to its industry. Click to see more on past growth.
When considering ROCE, bear in mind that it reflects the past and does not necessarily predict the future. ROCE can be deceptive for cyclical businesses, as returns can look incredible in boom times, and terribly low in downturns. ROCE is, after all, simply a snap shot of a single year. We note Cactus could be considered a cyclical business. Future performance is what matters, and you can see analyst predictions in our free report on analyst forecasts for the company.
How Cactus's Current Liabilities Impact Its ROCE
Current liabilities are short term bills and invoices that need to be paid in 12 months or less. The ROCE equation subtracts current liabilities from capital employed, so a company with a lot of current liabilities appears to have less capital employed, and a higher ROCE than otherwise. To counter this, investors can check if a company has high current liabilities relative to total assets.
Cactus has total assets of US$811m and current liabilities of US$90m. Therefore its current liabilities are equivalent to approximately 11% of its total assets. A minimal amount of current liabilities limits the impact on ROCE.
What We Can Learn From Cactus's ROCE
Low current liabilities and high ROCE is a good combination, making Cactus look quite interesting. Cactus shapes up well under this analysis, but it is far from the only business delivering excellent numbers . You might also want to check this free collection of companies delivering excellent earnings growth.
If you are like me, then you will not want to miss this free list of growing companies that insiders are buying.
We aim to bring you long-term focused research analysis driven by fundamental data. Note that our analysis may not factor in the latest price-sensitive company announcements or qualitative material.
If you spot an error that warrants correction, please contact the editor at editorial-team@simplywallst.com. This article by Simply Wall St is general in nature. It does not constitute a recommendation to buy or sell any stock, and does not take account of your objectives, or your financial situation. Simply Wall St has no position in the stocks mentioned. Thank you for reading.
