
 Yahoo Finance
 Should You Buy Texas Instruments (TXN) Stock Ahead of Earnings?

Shares of Texas Instruments TXN dipped into the red during early afternoon trading Monday, just one day before the chip behemoth is scheduled to release its latest quarterly earnings report. With concerns emerging that the dominant run for semiconductor stocks could be over soon, investors will want to key a close eye on the recent results of an industry bellwether like TXN.
Increased demand for its chips—thanks to a variety of new applications throughout the tech landscape—has helped Texas Instruments surge considerably over the past few years. However, volatility in the tech sector and semiconductor industry has taken the wind out of the stock’s sails in recent months.
Still, earnings growth in our “Semiconductor – General” group is expected to exceed 20% in 2018, and investors will hope that Texas Instruments can get things started with a strong report on Tuesday. Let’s take a closer look.
Latest Outlook and Valuation
Based on our latest Zacks Consensus Estimates, we expect Texas Instruments to report adjusted earnings of $4.99 per share and total revenue of $15.64 billion. These results would represent year-over-year growth rates of 16.6% and 4.6%, respectively.
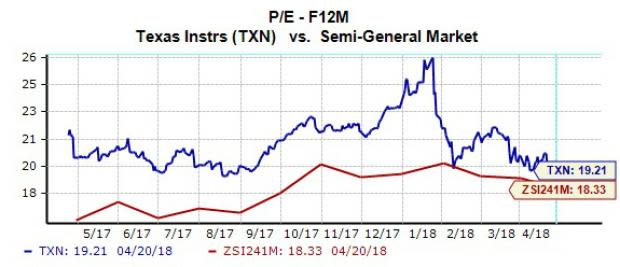
Heading into the week, TXN was trading at 19.2x forward 12-month earnings. Over the past year, its Forward P/E has been as high as 26.2 and has low as 18.9. It has traded with a median forward earnings multiple of 20.6x in that time. Its industry peers are currently sporting an average Forward P/E of 18.3. Investors might conclude that the stock is slightly discounted compared to where it has traded recently—but also slightly more expensive that its industry average.
Earnings ESP Whispers
Investors will also want to anticipate the likelihood that Texas Instruments surprises investors with better-than-anticipated earnings results. For this, we turn to our Earnings ESP figure.
Zacks Earnings ESP (Expected Surprise Prediction) looks to find earnings surprises by focusing on the most recent analyst estimates. This is done because, generally speaking, when an analyst posts an estimate right before an earnings release, it means that they have fresh information which could potentially be more accurate than what analysts thought about a company two or three months ago.
A positive Earnings ESP paired with a Zacks Rank #3 (Hold) or better ranking helps us feel confident about the potential for an earnings beat. In fact, our 10-year backtest has revealed that this methodology has accurately produced a positive surprise 70% of the time.
Texas Instrument is currently holding a Zacks Rank #2 (Buy) and an Earnings ESP of -1.4%. This means that the most recent analyst estimates have been slightly lower than the consensus. In other words, our model is not conclusively calling for a beat.
Surprise History
Another important thing to consider ahead of Texas Instrument’s report is the company’s history of earnings surprises and the effect that these surprises have had on share prices. The firm has met or surpassed estimates in each of the trailing ten quarters, but the stock has not always generated positive momentum during earnings season.
We judge the price effect of these earnings beats by comparing the closing price of the stock two days before the report and two days after the report. Over the course of Texas Instrument’s streak, shares of turned positive in just five of these windows.
Want more market analysis from this author? Make sure to follow @Ryan_McQueeney on Twitter!
Today's Stocks from Zacks' Hottest Strategies
It's hard to believe, even for us at Zacks. But while the market gained +21.9% in 2017, our top stock-picking screens have returned +115.0%, +109.3%, +104.9%, +98.6%, and +67.1%.
And this outperformance has not just been a recent phenomenon. Over the years it has been remarkably consistent. From 2000 - 2017, the composite yearly average gain for these strategies has beaten the market more than 19X over. Maybe even more remarkable is the fact that we're willing to share their latest stocks with you without cost or obligation.
See Them Free>>
Want the latest recommendations from Zacks Investment Research? Today, you can download 7 Best Stocks for the Next 30 Days. Click to get this free report
Texas Instruments Incorporated (TXN) : Free Stock Analysis Report
To read this article on Zacks.com click here.
Zacks Investment Research
