
 Yahoo Finance
 Before You Buy Prism Resources Inc. (CVE:PRS), Consider Its Volatility

Anyone researching Prism Resources Inc. (CVE:PRS) might want to consider the historical volatility of the share price. Volatility is considered to be a measure of risk in modern finance theory. Investors may think of volatility as falling into two main categories. The first category is company specific volatility. This can be dealt with by limiting your exposure to any particular stock. The other type, which cannot be diversified away, is the volatility of the entire market. Every stock in the market is exposed to this volatility, which is linked to the fact that stocks prices are correlated in an efficient market.
Some stocks see their prices move in concert with the market. Others tend towards stronger, gentler or unrelated price movements. Beta can be a useful tool to understand how much a stock is influenced by market risk (volatility). However, Warren Buffett said 'volatility is far from synonymous with risk' in his 2014 letter to investors. So, while useful, beta is not the only metric to consider. To use beta as an investor, you must first understand that the overall market has a beta of one. A stock with a beta below one is either less volatile than the market, or more volatile but not corellated with the overall market. In comparison a stock with a beta of over one tends to be move in a similar direction to the market in the long term, but with greater changes in price.
Check out our latest analysis for Prism Resources
What we can learn from PRS's beta value
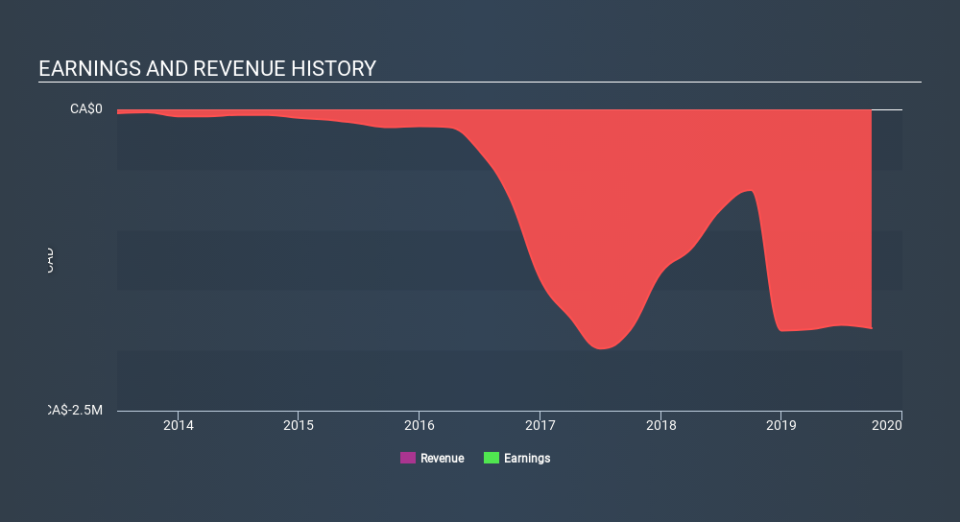
Looking at the last five years, Prism Resources has a beta of 0.81. The fact that this is well below 1 indicates that its share price movements haven't historically been very sensitive to overall market volatility. If history is a good guide, owning the stock should help ensure that your portfolio is not overly sensitive to market volatility. Many would argue that beta is useful in position sizing, but fundamental metrics such as revenue and earnings are more important overall. You can see Prism Resources's revenue and earnings in the image below.
Does PRS's size influence the expected beta?
With a market capitalisation of CA$1.3m, Prism Resources is a very small company by global standards. It is quite likely to be unknown to most investors. Companies with market capitalisations around this size often show poor correlation with the broader market because market volatility is overshadowed by company specific events, or other factors. It's worth checking to see how often shares are traded, because very small companies with very low beta values are often only thinly traded.
What this means for you:
The Prism Resources doesn't usually show much sensitivity to the broader market. This could be for a variety of reasons. Typically, smaller companies have a low beta if their share price tends to move a lot due to company specific developments. Alternatively, an strong dividend payer might move less than the market because investors are valuing it for its income stream. This article aims to educate investors about beta values, but it's well worth looking at important company-specific fundamentals such as Prism Resources’s financial health and performance track record. I urge you to continue your research by taking a look at the following:
Financial Health: Are PRS’s operations financially sustainable? Balance sheets can be hard to analyze, which is why we’ve done it for you. Check out our financial health checks here.
Past Track Record: Has PRS been consistently performing well irrespective of the ups and downs in the market? Go into more detail in the past performance analysis and take a look at the free visual representations of PRS's historicals for more clarity.
Other High-Performing Stocks: Are there other stocks that provide better prospects with proven track records? Explore our free list of these great stocks here.
If you spot an error that warrants correction, please contact the editor at editorial-team@simplywallst.com. This article by Simply Wall St is general in nature. It does not constitute a recommendation to buy or sell any stock, and does not take account of your objectives, or your financial situation. Simply Wall St has no position in the stocks mentioned.
We aim to bring you long-term focused research analysis driven by fundamental data. Note that our analysis may not factor in the latest price-sensitive company announcements or qualitative material. Thank you for reading.
