
 Yahoo Finance
 Brink's (NYSE:BCO) investors are sitting on a loss of 21% if they invested three years ago
Many investors define successful investing as beating the market average over the long term. But if you try your hand at stock picking, your risk returning less than the market. We regret to report that long term The Brink's Company (NYSE:BCO) shareholders have had that experience, with the share price dropping 24% in three years, versus a market return of about 27%.
With that in mind, it's worth seeing if the company's underlying fundamentals have been the driver of long term performance, or if there are some discrepancies.
View our latest analysis for Brink's
To quote Buffett, 'Ships will sail around the world but the Flat Earth Society will flourish. There will continue to be wide discrepancies between price and value in the marketplace...' One imperfect but simple way to consider how the market perception of a company has shifted is to compare the change in the earnings per share (EPS) with the share price movement.
During the unfortunate three years of share price decline, Brink's actually saw its earnings per share (EPS) improve by 41% per year. Given the share price reaction, one might suspect that EPS is not a good guide to the business performance during the period (perhaps due to a one-off loss or gain). Alternatively, growth expectations may have been unreasonable in the past.
Since the change in EPS doesn't seem to correlate with the change in share price, it's worth taking a look at other metrics.
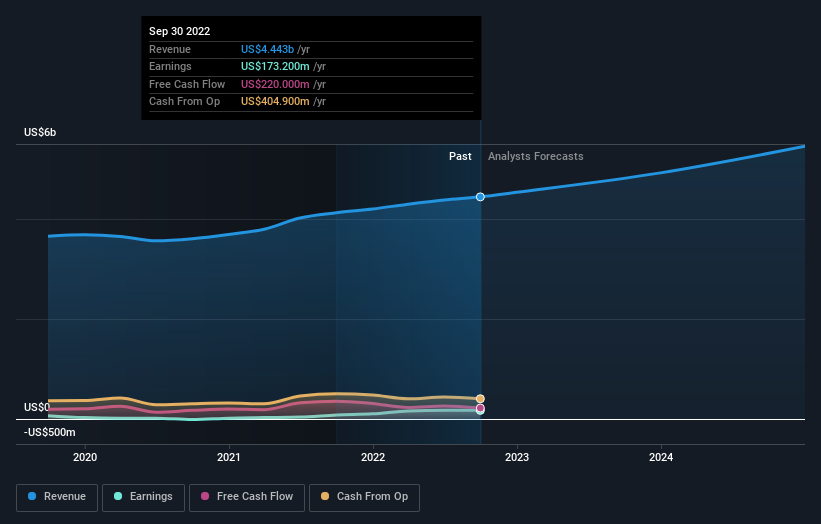
The modest 1.3% dividend yield is unlikely to be guiding the market view of the stock. Revenue is actually up 7.9% over the three years, so the share price drop doesn't seem to hinge on revenue, either. It's probably worth investigating Brink's further; while we may be missing something on this analysis, there might also be an opportunity.
You can see how earnings and revenue have changed over time in the image below (click on the chart to see the exact values).
We consider it positive that insiders have made significant purchases in the last year. Even so, future earnings will be far more important to whether current shareholders make money. You can see what analysts are predicting for Brink's in this interactive graph of future profit estimates.
What About Dividends?
As well as measuring the share price return, investors should also consider the total shareholder return (TSR). Whereas the share price return only reflects the change in the share price, the TSR includes the value of dividends (assuming they were reinvested) and the benefit of any discounted capital raising or spin-off. So for companies that pay a generous dividend, the TSR is often a lot higher than the share price return. We note that for Brink's the TSR over the last 3 years was -21%, which is better than the share price return mentioned above. And there's no prize for guessing that the dividend payments largely explain the divergence!
A Different Perspective
Brink's shareholders are down 6.3% over twelve months (even including dividends), which isn't far from the market return of -6.7%. Unfortunately, last year's performance is a deterioration of an already poor long term track record, given the loss of 2% per year over the last five years. It will probably take a substantial improvement in the fundamental performance for the company to reverse this trend. I find it very interesting to look at share price over the long term as a proxy for business performance. But to truly gain insight, we need to consider other information, too. Consider for instance, the ever-present spectre of investment risk. We've identified 1 warning sign with Brink's , and understanding them should be part of your investment process.
Brink's is not the only stock insiders are buying. So take a peek at this free list of growing companies with insider buying.
Please note, the market returns quoted in this article reflect the market weighted average returns of stocks that currently trade on US exchanges.
Have feedback on this article? Concerned about the content? Get in touch with us directly. Alternatively, email editorial-team (at) simplywallst.com.
This article by Simply Wall St is general in nature. We provide commentary based on historical data and analyst forecasts only using an unbiased methodology and our articles are not intended to be financial advice. It does not constitute a recommendation to buy or sell any stock, and does not take account of your objectives, or your financial situation. We aim to bring you long-term focused analysis driven by fundamental data. Note that our analysis may not factor in the latest price-sensitive company announcements or qualitative material. Simply Wall St has no position in any stocks mentioned.
Join A Paid User Research Session
You’ll receive a US$30 Amazon Gift card for 1 hour of your time while helping us build better investing tools for the individual investors like yourself. Sign up here
