
 Yahoo Finance
 Can BP Sustain its 93% Payout Ratio?
Energy stocks have lost their luster in 2019. In late August, the energy sector actually went negative for the year on the backdrop of an otherwise strong year for equities that has left the NASDAQ, S&P500, and Dow Jones Industrial average all well in the green. As a result of this glaring underperformance, it's time to evaluate if the largest oil and gas stocks, known as supermajors, have what it takes to rally back.
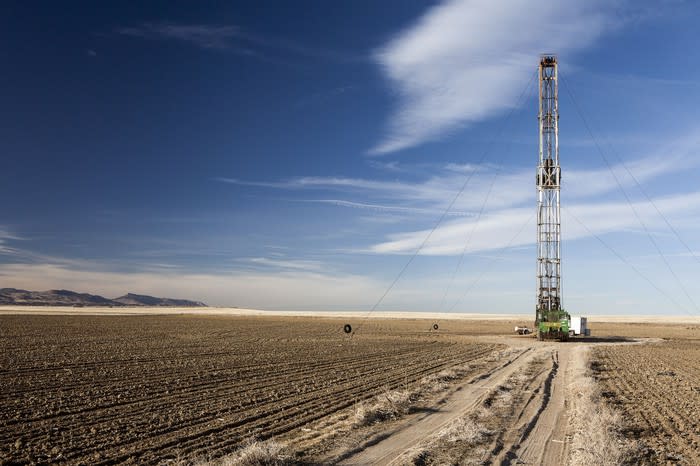
Image Source: Getty Images.
Out of the 5 supermajors covered in this article, ExxonMobil (NYSE:XOM), Royal Dutch Shell (NYSE:RDS-A), Chevron (NYSE:CVX), Total S.A. (TSX:TOT), and British Petroleum (NYSE:BP), BP has the smallest market capitalization, the largest payout ratio, the most levered debt/equity ratio, and is near-tied for the highest dividend yield with Shell. That being said, BP has a low 13.8 PE, significantly below the S&P 500 average of 21.3. While a nice dividend is cause for shareholder value, it can be misleading if accompanied by a high payout ratio.
$2.46/$2.63 = .935 or 93.5%
BP has a trailing twelve months (TTM) dividend per share (DPS) of $2.46 and TTM earnings per share (EPS) of $2.63. The payout ratio is calculated by dividing DPS by EPS, putting the company's payout ratio at a whopping 93%.
Integrated Oil and Gas Statistics* | ||||||
|---|---|---|---|---|---|---|
Company | Ticker | Market Capitalization | Dividend Yield | Payout Ratio | Debt/Equity (mrq) | PE Ratio |
S&P 500 | ^GSPC | 24.74T | 1.88% | N/A | N/A | 21.30 |
ExxonMobil | XOM | 287B | 5.16% | 80.24% | 25.53 | 16.35 |
Royal Dutch Shell | RDS-A | 223B | 6.82% | 75.81% | 47.21 | 11.14 |
Chevron | CVX | 219B | 4.13% | 59.84% | 22.04 | 14.99 |
Total S.A. | TOT | 126B | 6% | 72.24% | 51.97 | 12.13 |
British Petroleum | BP | 122B | 6.79% | 93.71% | 87.42 | 13.81 |
Source: Yahoo! Finance. *All figures approximate as of market close 8/26/2019. Figures may change due to market volatility.
BP's 93.5% payout ratio means that the company's annual dividend of $2.46 per share is 93.5% of its annual earnings of $2.63. That means that BP is only retaining 17 cents per share per year, leaving the company little room for error or capital reinvestment. That being said, BP isn't like most operators. Its offshore-heavy asset portfolio means more predictability and less correlation to oil prices. Although offshore projects are on a scale and capital intensity simply unheard of onshore, they tend to be a game of logistics and time management rather than reliance on spot prices or pipeline completions. Projects are rarely approved unless they have less than $30 per barrel breakeven price and can yield years and years of positive cash flow. In sum, although BP's balance sheet may be something to monitor, its asset portfolio is a sigh of relief.
That being said, BP isn't the cheapest oil supermajor, but it's also not the most expensive. The largest of the group, ExxonMobil, enjoys the most expensive valuation (PE) of 16.35 likely due to its size, stability, diverse asset portfolio, and industry-leading 25.53 debt/equity ratio, all the while sustaining a nice 5.16% dividend.
Runner up Chevron has gained a lot of praise recently, especially for its savvy negotiating on the Occidental Petroleum/Anadarko deal that resulted in Chevron pocketing a cool $1 billion just to walk away from the deal. BP is third, followed by Total and then Shell, which holds the lowest PE of the five.
More From The Motley Fool
Daniel Foelber owns shares of BP, Chevron, and ExxonMobil. The Motley Fool recommends TOTAL ENERGY SERVICES INC. The Motley Fool has a disclosure policy.
This article was originally published on Fool.com
