
 Yahoo Finance
 Black Diamond Group (TSE:BDI) Is Doing The Right Things To Multiply Its Share Price
Finding a business that has the potential to grow substantially is not easy, but it is possible if we look at a few key financial metrics. Amongst other things, we'll want to see two things; firstly, a growing return on capital employed (ROCE) and secondly, an expansion in the company's amount of capital employed. Put simply, these types of businesses are compounding machines, meaning they are continually reinvesting their earnings at ever-higher rates of return. Speaking of which, we noticed some great changes in Black Diamond Group's (TSE:BDI) returns on capital, so let's have a look.
Understanding Return On Capital Employed (ROCE)
For those that aren't sure what ROCE is, it measures the amount of pre-tax profits a company can generate from the capital employed in its business. Analysts use this formula to calculate it for Black Diamond Group:
Return on Capital Employed = Earnings Before Interest and Tax (EBIT) ÷ (Total Assets - Current Liabilities)
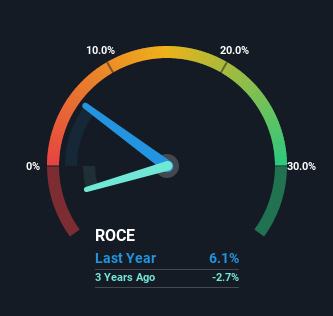
0.061 = CA$29m ÷ (CA$528m - CA$57m) (Based on the trailing twelve months to March 2022).
So, Black Diamond Group has an ROCE of 6.1%. On its own that's a low return on capital but it's in line with the industry's average returns of 6.1%.
Check out our latest analysis for Black Diamond Group
Above you can see how the current ROCE for Black Diamond Group compares to its prior returns on capital, but there's only so much you can tell from the past. If you'd like, you can check out the forecasts from the analysts covering Black Diamond Group here for free.
The Trend Of ROCE
We're delighted to see that Black Diamond Group is reaping rewards from its investments and has now broken into profitability. While the business was unprofitable in the past, it's now turned things around and is earning 6.1% on its capital. While returns have increased, the amount of capital employed by Black Diamond Group has remained flat over the period. So while we're happy that the business is more efficient, just keep in mind that could mean that going forward the business is lacking areas to invest internally for growth. So if you're looking for high growth, you'll want to see a business's capital employed also increasing.
The Bottom Line
As discussed above, Black Diamond Group appears to be getting more proficient at generating returns since capital employed has remained flat but earnings (before interest and tax) are up. Since the stock has returned a solid 52% to shareholders over the last five years, it's fair to say investors are beginning to recognize these changes. In light of that, we think it's worth looking further into this stock because if Black Diamond Group can keep these trends up, it could have a bright future ahead.
Black Diamond Group does have some risks though, and we've spotted 2 warning signs for Black Diamond Group that you might be interested in.
If you want to search for solid companies with great earnings, check out this free list of companies with good balance sheets and impressive returns on equity.
Have feedback on this article? Concerned about the content? Get in touch with us directly. Alternatively, email editorial-team (at) simplywallst.com.
This article by Simply Wall St is general in nature. We provide commentary based on historical data and analyst forecasts only using an unbiased methodology and our articles are not intended to be financial advice. It does not constitute a recommendation to buy or sell any stock, and does not take account of your objectives, or your financial situation. We aim to bring you long-term focused analysis driven by fundamental data. Note that our analysis may not factor in the latest price-sensitive company announcements or qualitative material. Simply Wall St has no position in any stocks mentioned.
