
 Yahoo Finance
 Bitcoin Price Forecast February 26, 2018, Technical Analysis
BTC/USD
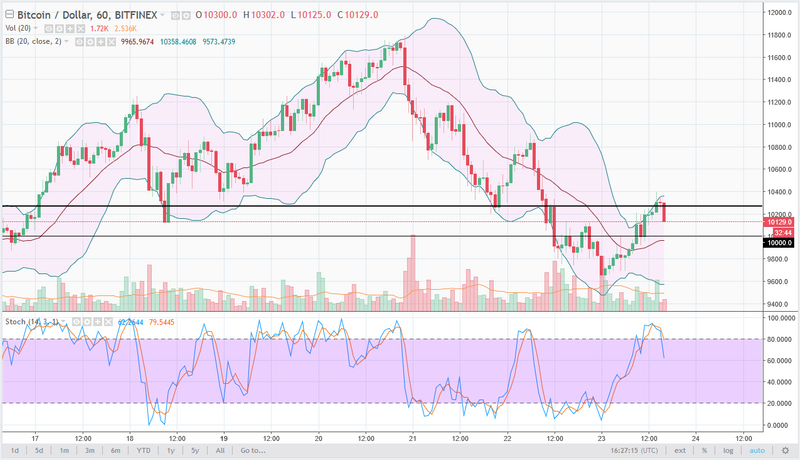
Bitcoin markets initially rally during the trading session on Monday but found enough resistance to turn things around and show signs of exhaustion towards the end of the week. More importantly, the weekly candle was a shooting star and I think this shows just how tenuous this rally has been. I think that the market will probably go back towards the $10,000 level, an area that will be very interesting to watch. As the market roles over, and it has lost a bit since I started writing this article, I think that we may see more people try to get out with small gains, or perhaps lessen the blow of longer-term moves.
BTC/USD Video 26.02.18
Get Into Bitcoin Trading Today
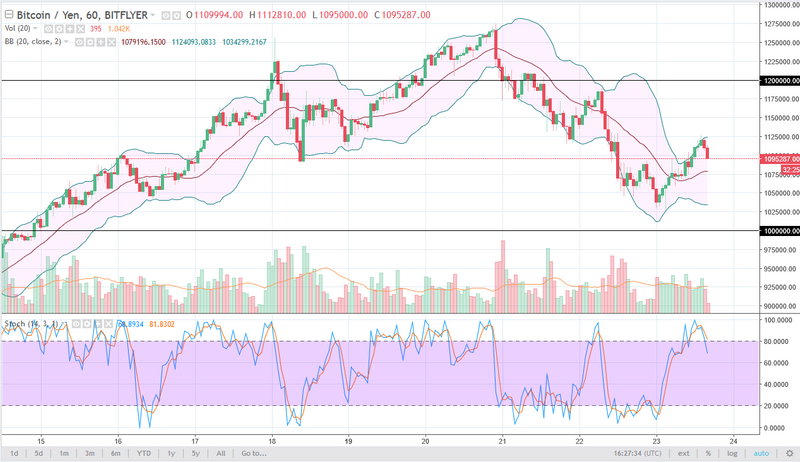
BTC/JPY
Bitcoin markets also rallied against the Japanese yen initially during the day on Friday but have also served to roll over at the first signs of trouble. The weekly chart in the BTC/JPY pair is also forming the shooting star, and that is a very negative sign. Over the longer term, I would anticipate that we are probably going to test the ¥1 million level, an area that is essentially “fair value” from the longer-term chart consolidation pattern that I think we are starting to form. At this point, I would anticipate buyers to come back towards this market at the ¥1 million level, so looking at a bounce there for buying opportunity might be the best way to go. Market participants continue to be aggressive in both directions.
This article was originally posted on FX Empire
