
 Yahoo Finance
 Birchcliff Energy Third Quarter 2022 Earnings: EPS: CA$0.92 (vs CA$0.52 in 3Q 2021)
Birchcliff Energy (TSE:BIR) Third Quarter 2022 Results
Key Financial Results
Revenue: CA$454.2m (up 79% from 3Q 2021).
Net income: CA$245.6m (up 78% from 3Q 2021).
Profit margin: 54% (in line with 3Q 2021).
EPS: CA$0.92 (up from CA$0.52 in 3Q 2021).
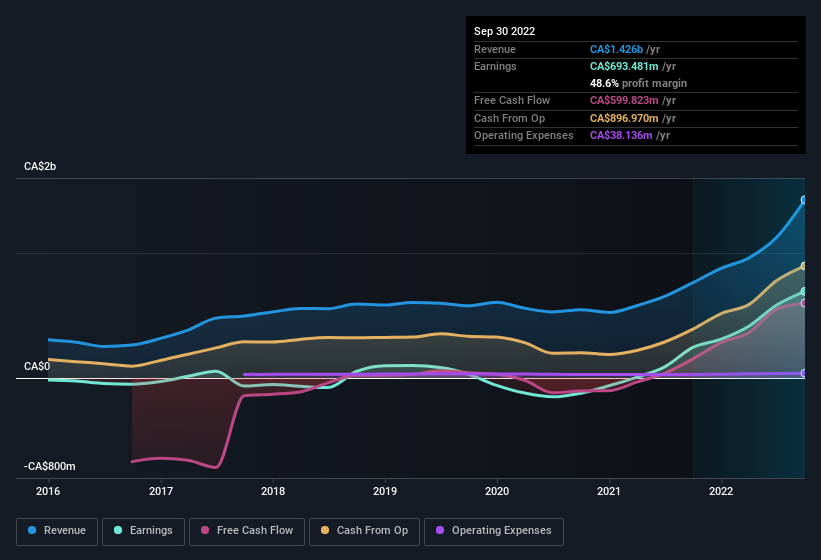
All figures shown in the chart above are for the trailing 12 month (TTM) period
Birchcliff Energy Earnings Insights
Looking ahead, revenue is expected to fall by 6.8% p.a. on average during the next 2 years compared to a 1.5% decline forecast for the Oil and Gas industry in Canada.
Performance of the Canadian Oil and Gas industry.
The company's share price is broadly unchanged from a week ago.
Balance Sheet Analysis
Just as investors must consider earnings, it is also important to take into account the strength of a company's balance sheet. We have a graphic representation of Birchcliff Energy's balance sheet and an in-depth analysis of the company's financial position.
Have feedback on this article? Concerned about the content? Get in touch with us directly. Alternatively, email editorial-team (at) simplywallst.com.
This article by Simply Wall St is general in nature. We provide commentary based on historical data and analyst forecasts only using an unbiased methodology and our articles are not intended to be financial advice. It does not constitute a recommendation to buy or sell any stock, and does not take account of your objectives, or your financial situation. We aim to bring you long-term focused analysis driven by fundamental data. Note that our analysis may not factor in the latest price-sensitive company announcements or qualitative material. Simply Wall St has no position in any stocks mentioned.
Join A Paid User Research Session
You’ll receive a US$30 Amazon Gift card for 1 hour of your time while helping us build better investing tools for the individual investors like yourself. Sign up here
