
 Yahoo Finance
 What Is BioSyent's (CVE:RX) P/E Ratio After Its Share Price Tanked?

Unfortunately for some shareholders, the BioSyent (CVE:RX) share price has dived 33% in the last thirty days. That drop has capped off a tough year for shareholders, with the share price down 53% in that time.
Assuming nothing else has changed, a lower share price makes a stock more attractive to potential buyers. In the long term, share prices tend to follow earnings per share, but in the short term prices bounce around in response to short term factors (which are not always obvious). So, on certain occasions, long term focussed investors try to take advantage of pessimistic expectations to buy shares at a better price. One way to gauge market expectations of a stock is to look at its Price to Earnings Ratio (PE Ratio). A high P/E implies that investors have high expectations of what a company can achieve compared to a company with a low P/E ratio.
Check out our latest analysis for BioSyent
How Does BioSyent's P/E Ratio Compare To Its Peers?
BioSyent has a P/E ratio of 11.23. The image below shows that BioSyent has a P/E ratio that is roughly in line with the pharmaceuticals industry average (11.2).
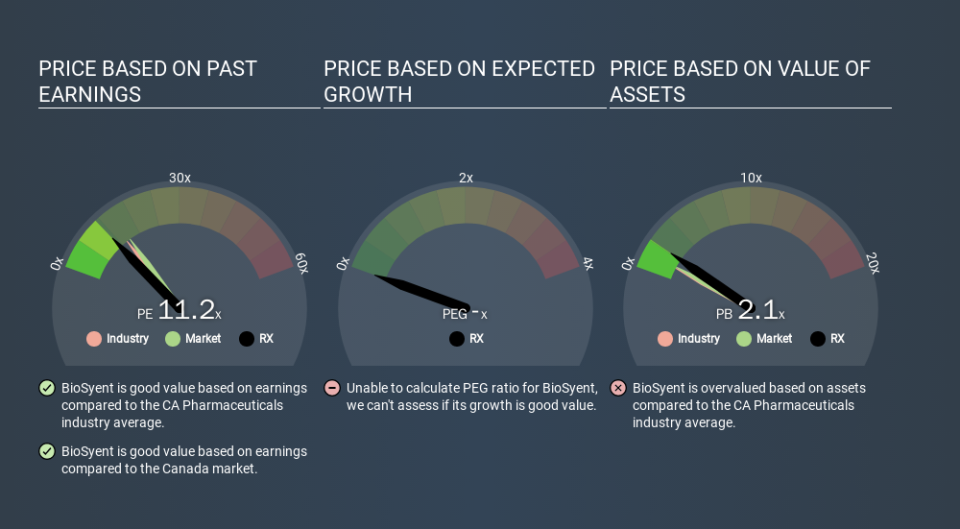
BioSyent's P/E tells us that market participants think its prospects are roughly in line with its industry. If the company has better than average prospects, then the market might be underestimating it. I would further inform my view by checking insider buying and selling., among other things.
How Growth Rates Impact P/E Ratios
Probably the most important factor in determining what P/E a company trades on is the earnings growth. That's because companies that grow earnings per share quickly will rapidly increase the 'E' in the equation. And in that case, the P/E ratio itself will drop rather quickly. Then, a lower P/E should attract more buyers, pushing the share price up.
BioSyent's earnings per share fell by 9.2% in the last twelve months. But EPS is up 9.9% over the last 5 years.
A Limitation: P/E Ratios Ignore Debt and Cash In The Bank
Don't forget that the P/E ratio considers market capitalization. So it won't reflect the advantage of cash, or disadvantage of debt. Hypothetically, a company could reduce its future P/E ratio by spending its cash (or taking on debt) to achieve higher earnings.
Such spending might be good or bad, overall, but the key point here is that you need to look at debt to understand the P/E ratio in context.
Is Debt Impacting BioSyent's P/E?
With net cash of CA$20m, BioSyent has a very strong balance sheet, which may be important for its business. Having said that, at 38% of its market capitalization the cash hoard would contribute towards a higher P/E ratio.
The Bottom Line On BioSyent's P/E Ratio
BioSyent has a P/E of 11.2. That's below the average in the CA market, which is 13.6. The recent drop in earnings per share would almost certainly temper expectations, the healthy balance sheet means the company retains potential for future growth. If that occurs, the current low P/E could prove to be temporary. What can be absolutely certain is that the market has become significantly less optimistic about BioSyent over the last month, with the P/E ratio falling from 16.8 back then to 11.2 today. For those who don't like to trade against momentum, that could be a warning sign, but a contrarian investor might want to take a closer look.
When the market is wrong about a stock, it gives savvy investors an opportunity. If the reality for a company is not as bad as the P/E ratio indicates, then the share price should increase as the market realizes this. So this free visualization of the analyst consensus on future earnings could help you make the right decision about whether to buy, sell, or hold.
You might be able to find a better buy than BioSyent. If you want a selection of possible winners, check out this free list of interesting companies that trade on a P/E below 20 (but have proven they can grow earnings).
If you spot an error that warrants correction, please contact the editor at editorial-team@simplywallst.com. This article by Simply Wall St is general in nature. It does not constitute a recommendation to buy or sell any stock, and does not take account of your objectives, or your financial situation. Simply Wall St has no position in the stocks mentioned.
We aim to bring you long-term focused research analysis driven by fundamental data. Note that our analysis may not factor in the latest price-sensitive company announcements or qualitative material. Thank you for reading.
