
 Yahoo Finance
 BIOREM (CVE:BRM) Will Want To Turn Around Its Return Trends
There are a few key trends to look for if we want to identify the next multi-bagger. Typically, we'll want to notice a trend of growing return on capital employed (ROCE) and alongside that, an expanding base of capital employed. Basically this means that a company has profitable initiatives that it can continue to reinvest in, which is a trait of a compounding machine. However, after briefly looking over the numbers, we don't think BIOREM (CVE:BRM) has the makings of a multi-bagger going forward, but let's have a look at why that may be.
Understanding Return On Capital Employed (ROCE)
If you haven't worked with ROCE before, it measures the 'return' (pre-tax profit) a company generates from capital employed in its business. To calculate this metric for BIOREM, this is the formula:
Return on Capital Employed = Earnings Before Interest and Tax (EBIT) ÷ (Total Assets - Current Liabilities)
0.07 = CA$989k ÷ (CA$24m - CA$10.0m) (Based on the trailing twelve months to June 2021).
So, BIOREM has an ROCE of 7.0%. Even though it's in line with the industry average of 7.5%, it's still a low return by itself.
See our latest analysis for BIOREM
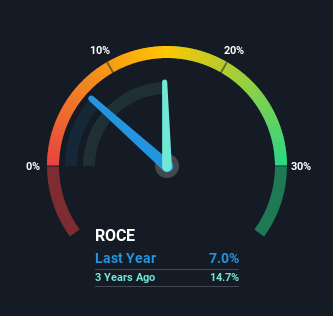
Historical performance is a great place to start when researching a stock so above you can see the gauge for BIOREM's ROCE against it's prior returns. If you want to delve into the historical earnings, revenue and cash flow of BIOREM, check out these free graphs here.
What The Trend Of ROCE Can Tell Us
When we looked at the ROCE trend at BIOREM, we didn't gain much confidence. To be more specific, ROCE has fallen from 56% over the last five years. And considering revenue has dropped while employing more capital, we'd be cautious. If this were to continue, you might be looking at a company that is trying to reinvest for growth but is actually losing market share since sales haven't increased.
On a side note, BIOREM has done well to pay down its current liabilities to 41% of total assets. That could partly explain why the ROCE has dropped. Effectively this means their suppliers or short-term creditors are funding less of the business, which reduces some elements of risk. Since the business is basically funding more of its operations with it's own money, you could argue this has made the business less efficient at generating ROCE. Keep in mind 41% is still pretty high, so those risks are still somewhat prevalent.
In Conclusion...
We're a bit apprehensive about BIOREM because despite more capital being deployed in the business, returns on that capital and sales have both fallen. But investors must be expecting an improvement of sorts because over the last five yearsthe stock has delivered a respectable 76% return. Regardless, we don't feel too comfortable with the fundamentals so we'd be steering clear of this stock for now.
If you'd like to know about the risks facing BIOREM, we've discovered 3 warning signs that you should be aware of.
While BIOREM isn't earning the highest return, check out this free list of companies that are earning high returns on equity with solid balance sheets.
This article by Simply Wall St is general in nature. It does not constitute a recommendation to buy or sell any stock, and does not take account of your objectives, or your financial situation. We aim to bring you long-term focused analysis driven by fundamental data. Note that our analysis may not factor in the latest price-sensitive company announcements or qualitative material. Simply Wall St has no position in any stocks mentioned.
Have feedback on this article? Concerned about the content? Get in touch with us directly. Alternatively, email editorial-team (at) simplywallst.com.
