
 Yahoo Finance
 Better Buy: Vanguard High Dividend Yield (VYM) vs. Schwab U.S. Dividend Equity (SCHD)
Income investors rely on stocks that pay dividends, and exchange-traded funds make it easy to buy a diversified set of dividend stocks in a single investment. Among the most popular dividend ETFs is the Vanguard High Dividend Yield ETF (NYSEMKT: VYM), which has used Vanguard's reputation for low cost to its advantage in building up billions of dollars in assets. More recently, Schwab U.S. Dividend Equity (NYSEMKT: SCHD) has sought to challenge Vanguard's low-cost leadership by sporting an even lower expense ratio. Below, we'll look at both of these dividend ETFs to help you decide which one might fit better in your portfolio.
Valuation and stock performance
Both Vanguard High Dividend Yield and Schwab U.S. Dividend Equity enjoyed solid returns in 2017, but the Schwab fund performed better. Over the past year, the Vanguard ETF is up 19%, while the Schwab fund managed to post a 23% gain. The two funds have a closer performance record over the past five years, but Schwab still holds a slight advantage of less than a percentage point over Vanguard in terms of average annual return over the period.
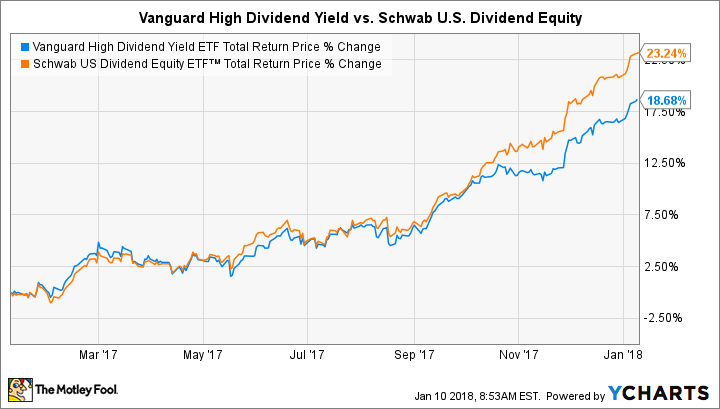
VYM Total Return Price data by YCharts.
The stocks within the two dividend ETFs' portfolios have very similar valuations. Both funds report price-to-earnings ratios among their components of between 20 and 21, although the price-to-book ratio for Schwab's holdings is higher than the corresponding figure for Vanguard. Both ETFs have higher earnings multiples than the broader market, which confirms the recent popularity of dividend stocks among investors.
Dividend income
Both dividend ETFs pay ample dividend income to their shareholders, but the Vanguard ETF has a slight edge right now. Its current yield as defined by the Securities and Exchange Commission is 2.84%, compared to 2.64% for the Schwab fund.
Dividend growth for the Schwab ETF has been extensive, with total distributions rising from about $0.90 per share in 2012 to $1.35 per share in 2017. That 50% gain for Schwab compares to a less extreme 37% rise from $1.75 to $2.40 per share for the Vanguard fund over the same period.

Image source: Schwab.
Growth, risk, and methodology
All dividend ETFs seek to deliver dividend income to shareholders, but the ways in which they do so differ. Various methodologies lead to very different benchmarks against which these passive ETFs weigh their performance, and the return results can vary widely.
The Vanguard ETF follows an index that includes stocks with dividend yields that are above the market average. That leads the fund to hold about 400 stocks, a broad swath of the overall market. Roughly equal holdings in technology, financials, consumer goods, healthcare, and industrial stocks also give the Vanguard ETF a broad base that spans the entire dividend investing universe. An expense ratio of 0.08% is quite attractive compared to most dividend ETFs.
The Schwab ETF tracks a much narrower index that emphasizes both dividend yield and a consistent track record of dividend payments. The fund holds just over 100 stocks, and its holdings are concentrated more heavily on technology and consumer stocks, with far less exposure to financials. The greater emphasis on tech stocks served the Schwab fund well during 2017, when the sector outperformed the broader market significantly. The ETF's expense ratio of 0.07% is even cheaper than Vanguard.
Which dividend ETF is right for you?
These two ETFs are very evenly matched, with Schwab having cheaper expenses and better recent returns. Even though the Vanguard fund has a higher current yield, Schwab's longer-term advantages give it a slight edge and could help it outperform in the years to come.
More From The Motley Fool
Dan Caplinger has no position in any of the stocks mentioned. The Motley Fool has no position in any of the stocks mentioned. The Motley Fool has a disclosure policy.
