These Are the Best Cities for Uber and Lyft Drivers (Infographic)
When you think of cities where ridesharing technology companies like Uber and Lyft are thriving, San Francisco and New York might be the cities to instantly jump to mind. That makes sense: Uber and Lyft both launched in San Francisco, and New York is filled with people who don’t own cars.
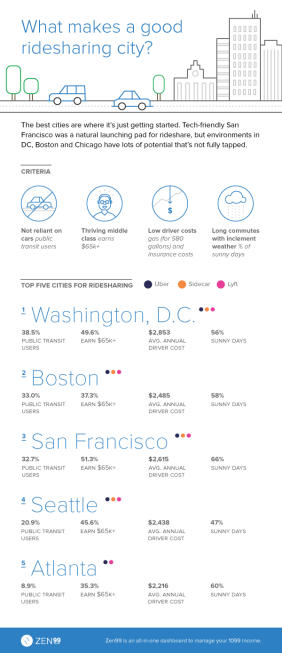
But there are other cities in the U.S. -- like Washington, D.C., Boston, Atlanta and Seattle -- where drivers for these companies have an opportunity to make bank. That’s according to some pretty nifty data analysis done by San Francisco-based Zen99, a financial software company that aims to help 1099 contract workers, particularly those in the sharing economy, organize their earnings and taxes.
Related: Who Exactly Are Uber's Drivers?
Zen99 examined what percentage of a city’s population depends on cars, what portion of the population is young (and therefore more likely to try newfangled smartphone technology that requires hoping in a car with a stranger) and the standard costs of maintaining a car. The company also factored in local weather conditions and average commute times. (That’s important: Waiting for a bus when it’s cold and raining is decidedly not cool and may make a consumer significantly more likely to pay for a car. )
Have a look at the infographic embedded below for more data on what makes a metropolitan area especially sharing-economy friendly. For true data nerds, there’s more analysis on ridesharing-attractiveness for another sixty-some cities here.
Related: Lyft Ditches Its Fluffy Pink Mustache for a Glowstache. Good Move or Bad?
Click to Enlarge
Related: Entrepreneurs Are Working to Uber-fy the Trucking Industry.

 Yahoo Finance

