
 Yahoo Finance
 Benign Growth For IBI Group Inc. (TSE:IBG) Underpins Its Share Price

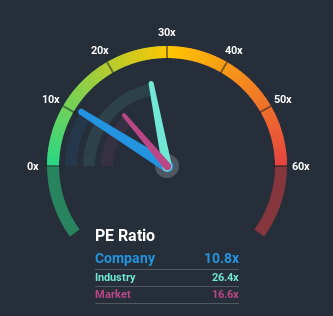
With a price-to-earnings (or "P/E") ratio of 10.8x IBI Group Inc. (TSE:IBG) may be sending bullish signals at the moment, given that almost half of all companies in Canada have P/E ratios greater than 17x and even P/E's higher than 39x are not unusual. However, the P/E might be low for a reason and it requires further investigation to determine if it's justified.
Recent times have been advantageous for IBI Group as its earnings have been rising faster than most other companies. It might be that many expect the strong earnings performance to degrade substantially, which has repressed the P/E. If not, then existing shareholders have reason to be quite optimistic about the future direction of the share price.
View our latest analysis for IBI Group
Keen to find out how analysts think IBI Group's future stacks up against the industry? In that case, our free report is a great place to start.
Does Growth Match The Low P/E?
There's an inherent assumption that a company should underperform the market for P/E ratios like IBI Group's to be considered reasonable.
Retrospectively, the last year delivered an exceptional 27% gain to the company's bottom line. The strong recent performance means it was also able to grow EPS by 85% in total over the last three years. So we can start by confirming that the company has done a great job of growing earnings over that time.
Shifting to the future, estimates from the six analysts covering the company suggest earnings should grow by 3.1% per year over the next three years. That's shaping up to be materially lower than the 29% per year growth forecast for the broader market.
With this information, we can see why IBI Group is trading at a P/E lower than the market. Apparently many shareholders weren't comfortable holding on while the company is potentially eyeing a less prosperous future.
What We Can Learn From IBI Group's P/E?
Typically, we'd caution against reading too much into price-to-earnings ratios when settling on investment decisions, though it can reveal plenty about what other market participants think about the company.
We've established that IBI Group maintains its low P/E on the weakness of its forecast growth being lower than the wider market, as expected. Right now shareholders are accepting the low P/E as they concede future earnings probably won't provide any pleasant surprises. Unless these conditions improve, they will continue to form a barrier for the share price around these levels.
Having said that, be aware IBI Group is showing 2 warning signs in our investment analysis, you should know about.
Of course, you might find a fantastic investment by looking at a few good candidates. So take a peek at this free list of companies with a strong growth track record, trading on a P/E below 20x.
This article by Simply Wall St is general in nature. It does not constitute a recommendation to buy or sell any stock, and does not take account of your objectives, or your financial situation. We aim to bring you long-term focused analysis driven by fundamental data. Note that our analysis may not factor in the latest price-sensitive company announcements or qualitative material. Simply Wall St has no position in any stocks mentioned.
Have feedback on this article? Concerned about the content? Get in touch with us directly. Alternatively, email editorial-team@simplywallst.com.
