
 Yahoo Finance
 Bengal Energy (TSE:BNG) delivers shareholders notable 93% return over 1 year, surging 13% in the last week alone
These days it's easy to simply buy an index fund, and your returns should (roughly) match the market. But one can do better than that by picking better than average stocks (as part of a diversified portfolio). For example, the Bengal Energy Ltd. (TSE:BNG) share price is up 93% in the last 1 year, clearly besting the market return of around 3.8% (not including dividends). So that should have shareholders smiling. However, the stock hasn't done so well in the longer term, with the stock only up 13% in three years.
On the back of a solid 7-day performance, let's check what role the company's fundamentals have played in driving long term shareholder returns.
View our latest analysis for Bengal Energy
While the efficient markets hypothesis continues to be taught by some, it has been proven that markets are over-reactive dynamic systems, and investors are not always rational. One flawed but reasonable way to assess how sentiment around a company has changed is to compare the earnings per share (EPS) with the share price.
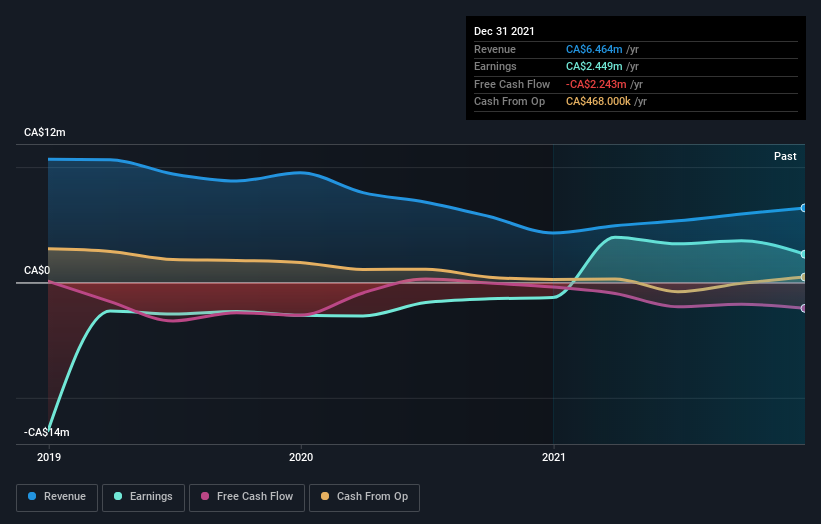
Bengal Energy went from making a loss to reporting a profit, in the last year.
When a company is just on the edge of profitability it can be well worth considering other metrics in order to more precisely gauge growth (and therefore understand share price movements).
However the year on year revenue growth of 50% would help. Many businesses do go through a phase where they have to forgo some profits to drive business development, and sometimes its for the best.
The company's revenue and earnings (over time) are depicted in the image below (click to see the exact numbers).
It's probably worth noting we've seen significant insider buying in the last quarter, which we consider a positive. That said, we think earnings and revenue growth trends are even more important factors to consider. This free interactive report on Bengal Energy's earnings, revenue and cash flow is a great place to start, if you want to investigate the stock further.
A Different Perspective
It's nice to see that Bengal Energy shareholders have received a total shareholder return of 93% over the last year. That certainly beats the loss of about 0.7% per year over the last half decade. This makes us a little wary, but the business might have turned around its fortunes. It's always interesting to track share price performance over the longer term. But to understand Bengal Energy better, we need to consider many other factors. Consider for instance, the ever-present spectre of investment risk. We've identified 5 warning signs with Bengal Energy , and understanding them should be part of your investment process.
Bengal Energy is not the only stock insiders are buying. So take a peek at this free list of growing companies with insider buying.
Please note, the market returns quoted in this article reflect the market weighted average returns of stocks that currently trade on CA exchanges.
Have feedback on this article? Concerned about the content? Get in touch with us directly. Alternatively, email editorial-team (at) simplywallst.com.
This article by Simply Wall St is general in nature. We provide commentary based on historical data and analyst forecasts only using an unbiased methodology and our articles are not intended to be financial advice. It does not constitute a recommendation to buy or sell any stock, and does not take account of your objectives, or your financial situation. We aim to bring you long-term focused analysis driven by fundamental data. Note that our analysis may not factor in the latest price-sensitive company announcements or qualitative material. Simply Wall St has no position in any stocks mentioned.
