
 Yahoo Finance
 BeiGene, Ltd.'s (NASDAQ:BGNE) Business Is Yet to Catch Up With Its Share Price
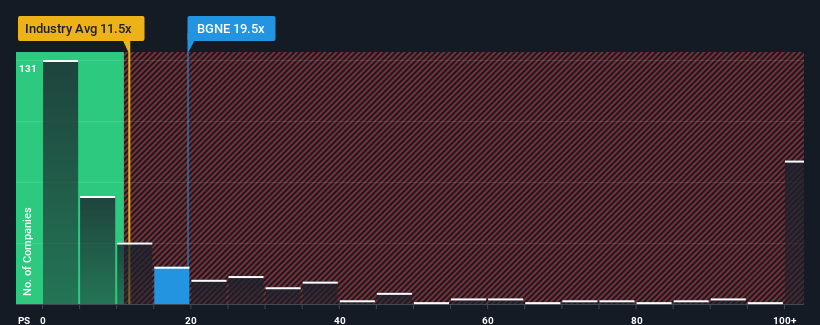
You may think that with a price-to-sales (or "P/S") ratio of 19.5x BeiGene, Ltd. (NASDAQ:BGNE) is a stock to avoid completely, seeing as almost half of all the Biotechs companies in the United States have P/S ratios under 11.5x and even P/S lower than 3x aren't out of the ordinary. Although, it's not wise to just take the P/S at face value as there may be an explanation why it's so lofty.
View our latest analysis for BeiGene
How Has BeiGene Performed Recently?
BeiGene could be doing better as it's been growing revenue less than most other companies lately. One possibility is that the P/S ratio is high because investors think this lacklustre revenue performance will improve markedly. You'd really hope so, otherwise you're paying a pretty hefty price for no particular reason.
Keen to find out how analysts think BeiGene's future stacks up against the industry? In that case, our free report is a great place to start.
How Is BeiGene's Revenue Growth Trending?
The only time you'd be truly comfortable seeing a P/S as steep as BeiGene's is when the company's growth is on track to outshine the industry decidedly.
If we review the last year of revenue growth, the company posted a terrific increase of 20%. The strong recent performance means it was also able to grow revenue by 231% in total over the last three years. Accordingly, shareholders would have definitely welcomed those medium-term rates of revenue growth.
Turning to the outlook, the next three years should generate growth of 39% per annum as estimated by the analysts watching the company. With the industry predicted to deliver 92% growth per annum, the company is positioned for a weaker revenue result.
In light of this, it's alarming that BeiGene's P/S sits above the majority of other companies. Apparently many investors in the company are way more bullish than analysts indicate and aren't willing to let go of their stock at any price. There's a good chance these shareholders are setting themselves up for future disappointment if the P/S falls to levels more in line with the growth outlook.
The Key Takeaway
Typically, we'd caution against reading too much into price-to-sales ratios when settling on investment decisions, though it can reveal plenty about what other market participants think about the company.
Despite analysts forecasting some poorer-than-industry revenue growth figures for BeiGene, this doesn't appear to be impacting the P/S in the slightest. When we see a weak revenue outlook, we suspect the share price faces a much greater risk of declining, bringing back down the P/S figures. At these price levels, investors should remain cautious, particularly if things don't improve.
There are also other vital risk factors to consider before investing and we've discovered 2 warning signs for BeiGene that you should be aware of.
If these risks are making you reconsider your opinion on BeiGene, explore our interactive list of high quality stocks to get an idea of what else is out there.
Have feedback on this article? Concerned about the content? Get in touch with us directly. Alternatively, email editorial-team (at) simplywallst.com.
This article by Simply Wall St is general in nature. We provide commentary based on historical data and analyst forecasts only using an unbiased methodology and our articles are not intended to be financial advice. It does not constitute a recommendation to buy or sell any stock, and does not take account of your objectives, or your financial situation. We aim to bring you long-term focused analysis driven by fundamental data. Note that our analysis may not factor in the latest price-sensitive company announcements or qualitative material. Simply Wall St has no position in any stocks mentioned.
Join A Paid User Research Session
You’ll receive a US$30 Amazon Gift card for 1 hour of your time while helping us build better investing tools for the individual investors like yourself. Sign up here
