
 Yahoo Finance
 Can BCE Inc.'s (TSE:BCE) ROE Continue To Surpass The Industry Average?
Many investors are still learning about the various metrics that can be useful when analysing a stock. This article is for those who would like to learn about Return On Equity (ROE). We'll use ROE to examine BCE Inc. (TSE:BCE), by way of a worked example.
ROE or return on equity is a useful tool to assess how effectively a company can generate returns on the investment it received from its shareholders. Simply put, it is used to assess the profitability of a company in relation to its equity capital.
Check out our latest analysis for BCE
How To Calculate Return On Equity?
Return on equity can be calculated by using the formula:
Return on Equity = Net Profit (from continuing operations) ÷ Shareholders' Equity
So, based on the above formula, the ROE for BCE is:
12% = CA$2.8b ÷ CA$22b (Based on the trailing twelve months to March 2023).
The 'return' is the amount earned after tax over the last twelve months. So, this means that for every CA$1 of its shareholder's investments, the company generates a profit of CA$0.12.
Does BCE Have A Good ROE?
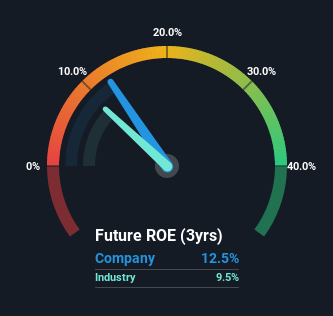
By comparing a company's ROE with its industry average, we can get a quick measure of how good it is. Importantly, this is far from a perfect measure, because companies differ significantly within the same industry classification. As is clear from the image below, BCE has a better ROE than the average (9.5%) in the Telecom industry.
That's clearly a positive. However, bear in mind that a high ROE doesn’t necessarily indicate efficient profit generation. Especially when a firm uses high levels of debt to finance its debt which may boost its ROE but the high leverage puts the company at risk. Our risks dashboardshould have the 2 risks we have identified for BCE.
Why You Should Consider Debt When Looking At ROE
Companies usually need to invest money to grow their profits. That cash can come from issuing shares, retained earnings, or debt. In the case of the first and second options, the ROE will reflect this use of cash, for growth. In the latter case, the debt used for growth will improve returns, but won't affect the total equity. That will make the ROE look better than if no debt was used.
Combining BCE's Debt And Its 12% Return On Equity
It's worth noting the high use of debt by BCE, leading to its debt to equity ratio of 1.52. There's no doubt its ROE is decent, but the very high debt the company carries is not too exciting to see. Debt does bring extra risk, so it's only really worthwhile when a company generates some decent returns from it.
Summary
Return on equity is a useful indicator of the ability of a business to generate profits and return them to shareholders. Companies that can achieve high returns on equity without too much debt are generally of good quality. All else being equal, a higher ROE is better.
But ROE is just one piece of a bigger puzzle, since high quality businesses often trade on high multiples of earnings. Profit growth rates, versus the expectations reflected in the price of the stock, are a particularly important to consider. So you might want to check this FREE visualization of analyst forecasts for the company.
If you would prefer check out another company -- one with potentially superior financials -- then do not miss this free list of interesting companies, that have HIGH return on equity and low debt.
Have feedback on this article? Concerned about the content? Get in touch with us directly. Alternatively, email editorial-team (at) simplywallst.com.
This article by Simply Wall St is general in nature. We provide commentary based on historical data and analyst forecasts only using an unbiased methodology and our articles are not intended to be financial advice. It does not constitute a recommendation to buy or sell any stock, and does not take account of your objectives, or your financial situation. We aim to bring you long-term focused analysis driven by fundamental data. Note that our analysis may not factor in the latest price-sensitive company announcements or qualitative material. Simply Wall St has no position in any stocks mentioned.
Join A Paid User Research Session
You’ll receive a US$30 Amazon Gift card for 1 hour of your time while helping us build better investing tools for the individual investors like yourself. Sign up here
