
 Yahoo Finance
 Bank of Montreal (BMO) Q3 Earnings Rise, Provisions Down

Bank of Montreal BMO reported third-quarter fiscal 2018 (ended Jul 31, 2018) adjusted net income of C$1.6 billion ($1.2 billion), which increased 14% year over year.
Results were primarily driven by rise in revenues and lower provisions. Moreover, balance-sheet position remained strong. However, higher expenses were an undermining factor.
After considering non-recurring items, net income was C$1.5 billion ($1.2 billion), up 11% from the prior-year quarter.
Revenues Improve, Provisions Decline, Expenses Up
Total revenues (on an adjusted basis), net of insurance claims, commissions and changes in policy benefit liabilities (CCPB), amounted to C$5.6 billion ($4.3 billion), up 7.7% year over year.
Net interest income rose 4% year over year to C$2.6 billion ($2.0 billion). Non-interest income came in at C$3.2 billion ($2.5 billion), up 10.3% year over year.
Adjusted non-interest expenses flared up 3.7% year over year to C$3.4 billion ($2.6 billion). Efficiency ratio, net of CCPB, was 61% at the quarter end compared with 63.1% as of Jul 31, 2017. Fall in efficiency ratio indicates improved profitability.
Adjusted provision for credit losses decreased 7.9% year over year to C$186 million ($142.6 million).
Balance Sheet Position
Total assets increased 8% from the prior-year quarter to C$765.3 billion ($587.8 billion) as of Jul 31, 2018. Further, net loans and acceptances were up nearly 5.9% year rover year to C$393.6 billion ($302.3 billion), while deposits rose 7.9% year rover year to C$506.9 billion ($389.3 billion).
Profitability & Capital Ratios Improve
Return on equity, as adjusted, came in at 15% in the reported quarter, up from 13.3% as of Jul 31, 2017.
As of Jul 31, 2018, common equity Tier I ratio came in at 11.4% compared with 11.2% witnessed in the year-ago quarter. Tier I capital ratio was 12.9%, in line with the prior-year quarter.
Our Viewpoint
Bank of Montreal’s focus and efforts remain aligned with its organic and inorganic growth strategies, and are expected to boost revenues, going forward. Also, the stock’s steady capital-deployment activities, supported by strong capital position will help it gain investors’ confidence. Nevertheless, mounting expenses continue to strain the company’s profitability.
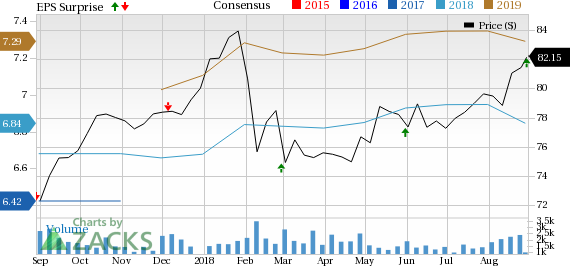
Bank Of Montreal Price, Consensus and EPS Surprise
Bank Of Montreal Price, Consensus and EPS Surprise | Bank Of Montreal Quote
Bank of Montreal currently carries a Zacks Rank #3 (Hold). You can see the complete list of today’s Zacks #1 Rank (Strong Buy) stocks here.
Competitive Landscape
UBS Group AG UBS reported second-quarter 2018 net profit attributable to shareholders of CHF 1.28 billion ($1.30 billion), up around 9% from the prior-year quarter. Results displayed rise in net fee and commission income (up 2% year over year) and strong capital position. However, the quarter reflected elevated expenses and lower net interest income (down 30%).
Deutsche Bank AG DB reported net income of €401 million ($467 million) in second-quarter 2018, which tanked 13.7% from year-ago quarter. Income before income taxes plunged 13.5% year over year to €711 million ($828.1 million). Lower revenues and higher expenses were the key undermining factors. Moreover, provisions for credit losses increased. Notably, net asset outflows were recorded during the quarter. Nevertheless, strong capital position was a positive.
Itau Unibanco Holding S.A. ITUB posted recurring earnings of R$6.4 billion ($1.78 billion) in second-quarter 2018, up 3.2% year over year. Including non-recurring items, net income came in at R$6.2 billion ($1.72 billion), up 3.3% year over year. Results display higher revenues, lower provisions and a solid balance-sheet position. Nonetheless, elevated expenses and reduced managerial financial margin were headwinds.
Looking for Stocks with Skyrocketing Upside?
Zacks has just released a Special Report on the booming investment opportunities of legal marijuana.
Ignited by new referendums and legislation, this industry is expected to blast from an already robust $6.7 billion to $20.2 billion in 2021. Early investors stand to make a killing, but you have to be ready to act and know just where to look.
See the pot trades we're targeting>>
Want the latest recommendations from Zacks Investment Research? Today, you can download 7 Best Stocks for the Next 30 Days. Click to get this free report
Deutsche Bank Aktiengesellschaft (DB) : Free Stock Analysis Report
Itau Unibanco Holding S.A. (ITUB) : Free Stock Analysis Report
Bank Of Montreal (BMO) : Free Stock Analysis Report
UBS Group AG (UBS) : Free Stock Analysis Report
To read this article on Zacks.com click here.
Zacks Investment Research
