
 Yahoo Finance
 Is Babcock & Wilcox Enterprises, Inc. (NYSE:BW) Expensive For A Reason? A Look At Its Intrinsic Value
Key Insights
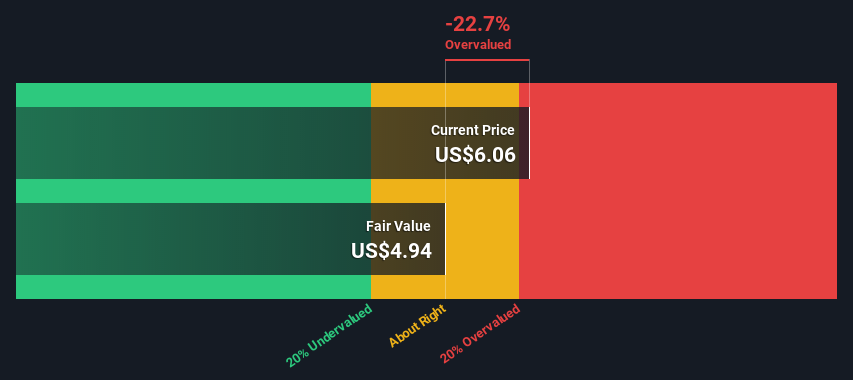
The projected fair value for Babcock & Wilcox Enterprises is US$4.94 based on 2 Stage Free Cash Flow to Equity
Babcock & Wilcox Enterprises is estimated to be 23% overvalued based on current share price of US$6.06
Our fair value estimate is 45% lower than Babcock & Wilcox Enterprises' analyst price target of US$9.00
Does the April share price for Babcock & Wilcox Enterprises, Inc. (NYSE:BW) reflect what it's really worth? Today, we will estimate the stock's intrinsic value by estimating the company's future cash flows and discounting them to their present value. We will take advantage of the Discounted Cash Flow (DCF) model for this purpose. Believe it or not, it's not too difficult to follow, as you'll see from our example!
We would caution that there are many ways of valuing a company and, like the DCF, each technique has advantages and disadvantages in certain scenarios. If you still have some burning questions about this type of valuation, take a look at the Simply Wall St analysis model.
Check out our latest analysis for Babcock & Wilcox Enterprises
What's The Estimated Valuation?
We use what is known as a 2-stage model, which simply means we have two different periods of growth rates for the company's cash flows. Generally the first stage is higher growth, and the second stage is a lower growth phase. To begin with, we have to get estimates of the next ten years of cash flows. Where possible we use analyst estimates, but when these aren't available we extrapolate the previous free cash flow (FCF) from the last estimate or reported value. We assume companies with shrinking free cash flow will slow their rate of shrinkage, and that companies with growing free cash flow will see their growth rate slow, over this period. We do this to reflect that growth tends to slow more in the early years than it does in later years.
Generally we assume that a dollar today is more valuable than a dollar in the future, and so the sum of these future cash flows is then discounted to today's value:
10-year free cash flow (FCF) estimate
2023 | 2024 | 2025 | 2026 | 2027 | 2028 | 2029 | 2030 | 2031 | 2032 | |
Levered FCF ($, Millions) | US$16.7m | US$25.3m | US$32.1m | US$38.4m | US$43.8m | US$48.5m | US$52.4m | US$55.7m | US$58.4m | US$60.8m |
Growth Rate Estimate Source | Analyst x1 | Analyst x2 | Est @ 26.94% | Est @ 19.48% | Est @ 14.26% | Est @ 10.60% | Est @ 8.04% | Est @ 6.25% | Est @ 5.00% | Est @ 4.12% |
Present Value ($, Millions) Discounted @ 12% | US$15.0 | US$20.3 | US$23.1 | US$24.7 | US$25.3 | US$25.0 | US$24.2 | US$23.1 | US$21.7 | US$20.2 |
("Est" = FCF growth rate estimated by Simply Wall St)
Present Value of 10-year Cash Flow (PVCF) = US$223m
The second stage is also known as Terminal Value, this is the business's cash flow after the first stage. For a number of reasons a very conservative growth rate is used that cannot exceed that of a country's GDP growth. In this case we have used the 5-year average of the 10-year government bond yield (2.1%) to estimate future growth. In the same way as with the 10-year 'growth' period, we discount future cash flows to today's value, using a cost of equity of 12%.
Terminal Value (TV)= FCF2032 × (1 + g) ÷ (r – g) = US$61m× (1 + 2.1%) ÷ (12%– 2.1%) = US$649m
Present Value of Terminal Value (PVTV)= TV / (1 + r)10= US$649m÷ ( 1 + 12%)10= US$216m
The total value is the sum of cash flows for the next ten years plus the discounted terminal value, which results in the Total Equity Value, which in this case is US$438m. The last step is to then divide the equity value by the number of shares outstanding. Relative to the current share price of US$6.1, the company appears slightly overvalued at the time of writing. Valuations are imprecise instruments though, rather like a telescope - move a few degrees and end up in a different galaxy. Do keep this in mind.
Important Assumptions
We would point out that the most important inputs to a discounted cash flow are the discount rate and of course the actual cash flows. You don't have to agree with these inputs, I recommend redoing the calculations yourself and playing with them. The DCF also does not consider the possible cyclicality of an industry, or a company's future capital requirements, so it does not give a full picture of a company's potential performance. Given that we are looking at Babcock & Wilcox Enterprises as potential shareholders, the cost of equity is used as the discount rate, rather than the cost of capital (or weighted average cost of capital, WACC) which accounts for debt. In this calculation we've used 12%, which is based on a levered beta of 1.612. Beta is a measure of a stock's volatility, compared to the market as a whole. We get our beta from the industry average beta of globally comparable companies, with an imposed limit between 0.8 and 2.0, which is a reasonable range for a stable business.
SWOT Analysis for Babcock & Wilcox Enterprises
Strength
Debt is well covered by .
Weakness
Interest payments on debt are not well covered.
Shareholders have been diluted in the past year.
Opportunity
Expected to breakeven next year.
Good value based on P/S ratio compared to estimated Fair P/S ratio.
Significant insider buying over the past 3 months.
Threat
Debt is not well covered by operating cash flow.
Total liabilities exceed total assets, which raises the risk of financial distress.
Moving On:
Although the valuation of a company is important, it is only one of many factors that you need to assess for a company. It's not possible to obtain a foolproof valuation with a DCF model. Rather it should be seen as a guide to "what assumptions need to be true for this stock to be under/overvalued?" For instance, if the terminal value growth rate is adjusted slightly, it can dramatically alter the overall result. Can we work out why the company is trading at a premium to intrinsic value? For Babcock & Wilcox Enterprises, we've put together three additional elements you should further research:
Risks: For instance, we've identified 2 warning signs for Babcock & Wilcox Enterprises that you should be aware of.
Management:Have insiders been ramping up their shares to take advantage of the market's sentiment for BW's future outlook? Check out our management and board analysis with insights on CEO compensation and governance factors.
Other High Quality Alternatives: Do you like a good all-rounder? Explore our interactive list of high quality stocks to get an idea of what else is out there you may be missing!
PS. Simply Wall St updates its DCF calculation for every American stock every day, so if you want to find the intrinsic value of any other stock just search here.
Have feedback on this article? Concerned about the content? Get in touch with us directly. Alternatively, email editorial-team (at) simplywallst.com.
This article by Simply Wall St is general in nature. We provide commentary based on historical data and analyst forecasts only using an unbiased methodology and our articles are not intended to be financial advice. It does not constitute a recommendation to buy or sell any stock, and does not take account of your objectives, or your financial situation. We aim to bring you long-term focused analysis driven by fundamental data. Note that our analysis may not factor in the latest price-sensitive company announcements or qualitative material. Simply Wall St has no position in any stocks mentioned.
Join A Paid User Research Session
You’ll receive a US$30 Amazon Gift card for 1 hour of your time while helping us build better investing tools for the individual investors like yourself. Sign up here
