
 Yahoo Finance
 Avon (AVP) Q2 Earnings & Sales Beat Estimates, Stock Up
Avon Products Inc. AVP delivered top and bottom-line beat in second-quarter 2019, driven by improvement in adjusted operating margin and continued progress on the “Open Up Avon” strategy. A clear reflection of this Zacks Rank #2 (Buy) company’s robust top and bottom-line performance was visible in nearly 2% increase in its share price yesterday.
Moreover, the stock has gained 52.1% in the past three months, outperforming the industry’s growth of 3.1%. This was mainly attributed to smooth progress on its “Open Up Avon” strategy, which aided quarterly results.

Avon’s adjusted earnings of 6 cents per share beat the Zacks Consensus Estimate of 4 cents. In the year-ago quarter, it recorded loss per share of 3 cents. On a GAAP basis, the company incurred loss of 3 cents per share compared with loss of 9 cents registered in the year-ago quarter.
Avon Products, Inc. Price, Consensus and EPS Surprise
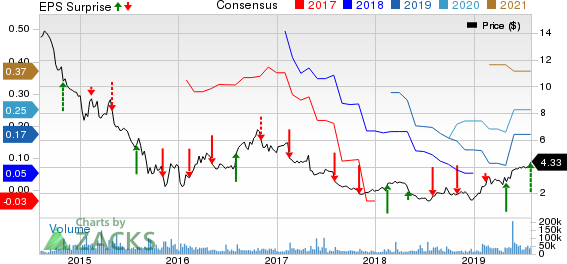
Avon Products, Inc. price-consensus-eps-surprise-chart | Avon Products, Inc. Quote
Q2 in Detail
Total revenues for Avon declined 13% year over year to $1,174.8 million but surpassed the Zacks Consensus Estimate of $1,246 million. In constant dollars, total revenues dipped 5%. Further, total Reportable Segment revenues (in reported currency) declined 12% to $1,170.3 million mostly due to adverse currency movements, offset by benefits of favorable price/mix and rise in Average Representatives sales. In constant currency, total Reportable Segment revenues dropped 5%. Currency headwinds impacted the company’s revenues by 8%.
Average Representatives sales in constant dollars from Reportable Segments improved 5% while price/mix rose 9%, driven by growth in all reportable segments. The improved price/mix and Average Representatives sales were driven by the smooth execution of the Open Up Avon strategy with an increased focus on productivity initiatives in the second quarter, including lesser discounts, more effective incentives, optimized promotions and a more favorable mix.
Adjusted gross margin contracted 170 basis points (bps) to 58.4%, driven by adverse impact of currency headwinds.
However, the company’s stringent focus on pricing and productivity gains during the quarter drove adjusted operating margin expansion as well as improved cash flow.
While the company’s operating margin on a GAAP basis contracted 130 bps, adjusted operating margin expanded 190 bps to 7.6%. This growth was mainly driven by increased savings across multiple cost lines and improved price/mix due to pricing efforts. The rise came despite adverse impacts of foreign currency, which impacted adjusted operating margin by 160 bps, particularly from Brazil, Argentina and Turkey.
Segmental Performance
Avon’s Europe, Middle East & Africa segment generated revenues of $425.1 million, which fell 15% year over year. On a currency-neutral basis, revenues were down 8%. Results included a 9% decline in Active Representatives and a 14% fall in units sold. These were offset by 6% growth in price/mix and 1% rise in Average Representatives Sales.
South Latin America’s revenues declined 14% to $443 million and remained flat on a constant-dollar basis. In the reported quarter, Active Representatives declined 12%, with units sold falling 17%. However, the segment witnessed a 12% increase in Average Representatives Sales and 17% rise in price/mix.
North Latin America’s revenues dropped 7% year over year to $193.8 million and were down 6% in constant dollars. While Active Representatives were down 10% year over year, units sold fell 8%. However, the segment reported 4% gain in Average Representatives Sales and 2% growth in price/mix.
Asia Pacific’s revenues declined 4% to $108.4 million and dropped 3% in constant dollars mainly as Active Representatives and units sold fell 9% each. However, this was partly offset by 6% rise each in Average Representatives sales and price/mix.
Financial Details
Avon ended the quarter with cash and cash equivalents of $421 million, long-term debt of $1,197 million, and total shareholders’ deficit of $964.5 million (excluding non-controlling interests).
As already stated, pricing and productivity initiatives under the Open Up Avon strategy significantly aided profitability and free cash flow in the second quarter. The company reported free cash flow of $26.3 million in the quarter, marking a $59.6-million improvement from negative free cash flow of $33.3 million in the year-ago quarter.
Additionally, net cash provided by operating activities as of Jun 30, 2019, was $7.1 million, improving $17.5 million from the year-ago quarter period. This was driven by improvements in earnings and working capital as well as $30 million in cash generated from the sale of assets in the Malaysia and Rye facilities.
The company remains on track for positive cash flow generation in 2019, driven by continued profit generation along with working capital efficiencies and monetization of non-core assets. Further, it is likely to benefit from self funding of the transformation plan.
Other Developments
In April 2019, Avon agreed to sell 19.9% ownership interest in New Avon to LG Household & Health Care Ltd. New Avon is a privately-held company that is majorly owned and managed by an affiliate of Cerberus. LG Household & Health Care agreed to pay $125 million for the purchase, with Avon receiving about $24.9 million for its 19.9% stake. The transaction is likely to close on Sep 30, 2019.
Other Top-Ranked Cosmetics Industry Stocks to Count On
Helen of Troy Limited HELE has an expected long-term earnings growth rate of 6.7% and a Zacks Rank #1 (Strong Buy). You can see the complete list of today’s Zacks #1 Rank stocks here.
The Estee Lauder Companies Inc. EL has an impressive long-term earnings growth rate of 13% and a Zacks Rank #2.
Inter Parfums, Inc. IPAR also carries a Zacks Rank #2 and has an impressive long-term earnings growth rate of 12.3%.
Breakout Biotech Stocks with Triple-Digit Profit Potential
The biotech sector is projected to surge beyond $775 billion by 2024 as scientists develop treatments for thousands of diseases. They’re also finding ways to edit the human genome to literally erase our vulnerability to these diseases.
Zacks has just released Century of Biology: 7 Biotech Stocks to Buy Right Now to help investors profit from 7 stocks poised for outperformance. Our recent biotech recommendations have produced gains of +98%, +119% and +164% in as little as 1 month. The stocks in this report could perform even better.
See these 7 breakthrough stocks now>>
Want the latest recommendations from Zacks Investment Research? Today, you can download 7 Best Stocks for the Next 30 Days. Click to get this free report
Helen of Troy Limited (HELE) : Free Stock Analysis Report
The Estee Lauder Companies Inc. (EL) : Free Stock Analysis Report
Avon Products, Inc. (AVP) : Free Stock Analysis Report
Inter Parfums, Inc. (IPAR) : Free Stock Analysis Report
To read this article on Zacks.com click here.
Zacks Investment Research
