
 Yahoo Finance
 Australian Vintage (ASX:AVG) Share Prices Have Dropped 15% In The Last Year

Want to participate in a short research study? Help shape the future of investing tools and earn a $40 gift card!
The simplest way to benefit from a rising market is to buy an index fund. When you buy individual stocks, you can make higher profits, but you also face the risk of under-performance. Unfortunately the Australian Vintage Ltd (ASX:AVG) share price slid 15% over twelve months. That contrasts poorly with the market decline of 7.0%. At least the damage isn't so bad if you look at the last three years, since the stock is down 5.8% in that time.
View our latest analysis for Australian Vintage
There is no denying that markets are sometimes efficient, but prices do not always reflect underlying business performance. One flawed but reasonable way to assess how sentiment around a company has changed is to compare the earnings per share (EPS) with the share price.
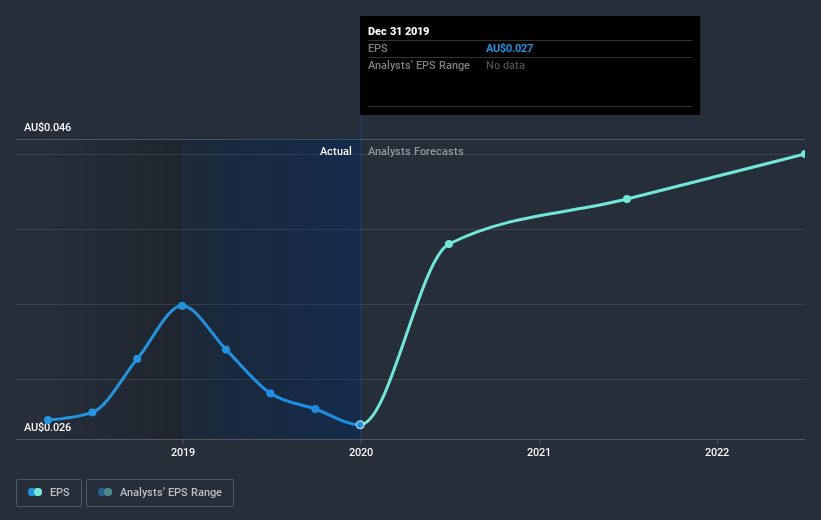
Unhappily, Australian Vintage had to report a 23% decline in EPS over the last year. This fall in the EPS is significantly worse than the 15% the share price fall. It may have been that the weak EPS was not as bad as some had feared.
The image below shows how EPS has tracked over time (if you click on the image you can see greater detail).
It might be well worthwhile taking a look at our free report on Australian Vintage's earnings, revenue and cash flow.
What About Dividends?
It is important to consider the total shareholder return, as well as the share price return, for any given stock. The TSR is a return calculation that accounts for the value of cash dividends (assuming that any dividend received was reinvested) and the calculated value of any discounted capital raisings and spin-offs. So for companies that pay a generous dividend, the TSR is often a lot higher than the share price return. In the case of Australian Vintage, it has a TSR of -11% for the last year. That exceeds its share price return that we previously mentioned. And there's no prize for guessing that the dividend payments largely explain the divergence!
A Different Perspective
While the broader market lost about 7.0% in the twelve months, Australian Vintage shareholders did even worse, losing 11% (even including dividends) . Having said that, it's inevitable that some stocks will be oversold in a falling market. The key is to keep your eyes on the fundamental developments. Longer term investors wouldn't be so upset, since they would have made 3.1%, each year, over five years. If the fundamental data continues to indicate long term sustainable growth, the current sell-off could be an opportunity worth considering. It's always interesting to track share price performance over the longer term. But to understand Australian Vintage better, we need to consider many other factors. Case in point: We've spotted 3 warning signs for Australian Vintage you should be aware of.
Of course, you might find a fantastic investment by looking elsewhere. So take a peek at this free list of companies we expect will grow earnings.
Please note, the market returns quoted in this article reflect the market weighted average returns of stocks that currently trade on AU exchanges.
This article by Simply Wall St is general in nature. It does not constitute a recommendation to buy or sell any stock, and does not take account of your objectives, or your financial situation. We aim to bring you long-term focused analysis driven by fundamental data. Note that our analysis may not factor in the latest price-sensitive company announcements or qualitative material. Simply Wall St has no position in any stocks mentioned.
Have feedback on this article? Concerned about the content? Get in touch with us directly. Alternatively, email editorial-team@simplywallst.com.
