
 Yahoo Finance
 AUD/USD, NZD/USD, USD/CNY – Aussie Lower, New Zealand Dollar and Chinese Yuan Stay Steady
AUD/USD
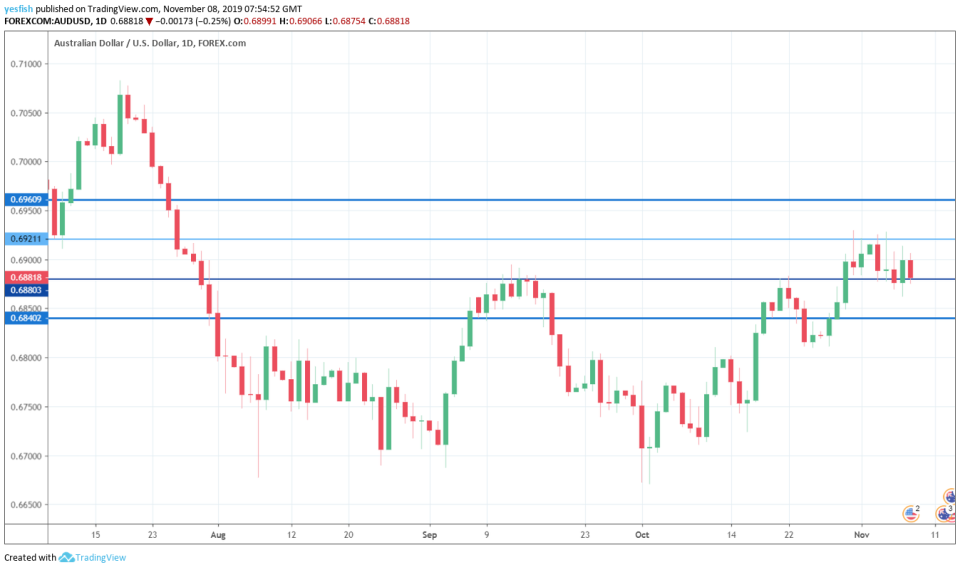
AUD/USD has posted losses on Friday, erasing most of the gains seen on Thursday. In the European session, the pair is trading at 0.6879, down 0.29% on the day.
Dovish RBA Statement Weighs on Aussie
The RBA statement began an on optimistic note, stating that the “Australian economy is gradually coming out of a soft patch”. However, the bank’s message was decidedly dovish, which said that wage growth was no longer expected to pick up”. The RBA confirmed an easing basis, but is not expected to resume its rate cuts just yet, after trimming rates three times in the past four months. Still, analysts expect further cuts in 2020, which is bearish for the currency.
AUD/USD Technical Analysis
AUD/USD remains range-bound, but both support and resistance barriers remain vulnerable. The pair has been lackluster this week, so any hopes of a breakout will have to wait until next week. On the upside, there is resistance at 0.6920. On the downside, 0.6880 remains under pressure. Below, we find support at 0.6840.
USD/CNY
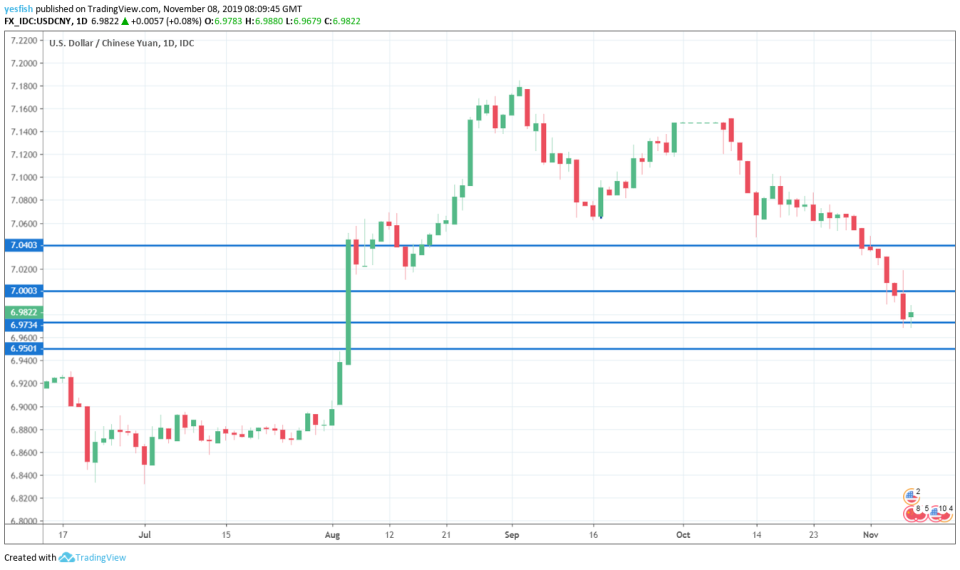
USD/CNY has posted gains on Friday. In the European session, the pair is trading at 6.9826, up 0.12% on the day. Earlier in the day, USD/CNY touched a low of 6.9679 its lowest level since August 5.
Chinese Exports Decline
Chinese exports declined for a third straight month, the first time that has occurred since 2016. Still, the drop was relatively mild, at 0.9%. There is renewed optimism that an interim trade deal is imminent, after a Chinese report on Thursday that the U.S. and China had agreed to phase out tariffs.
Ahead – Chinese CPI
Chinese CPI has been pointing upwards since the first quarter of 2019 and reached 3.0% in September. The upward trend is projected to continue in October, with an estimate of 3.2%. Higher inflation levels point to increased economic activity and this is bullish for the Chinese yuan.
USD/CNY Technical Analysis
USD/CNY remains at low levels and has declined by 1.0% since October 31. The pair has recorded eight straight losing sessions, although the yuan is slightly lower on Friday. With the pair breaking below the symbolic level of 7.00 earlier in the week, I expect the downtrend to continue. The pair tested support at 6.9735 in the Asian session and this line could break next week. Below, we have support at 6.9500.
NZD/USD
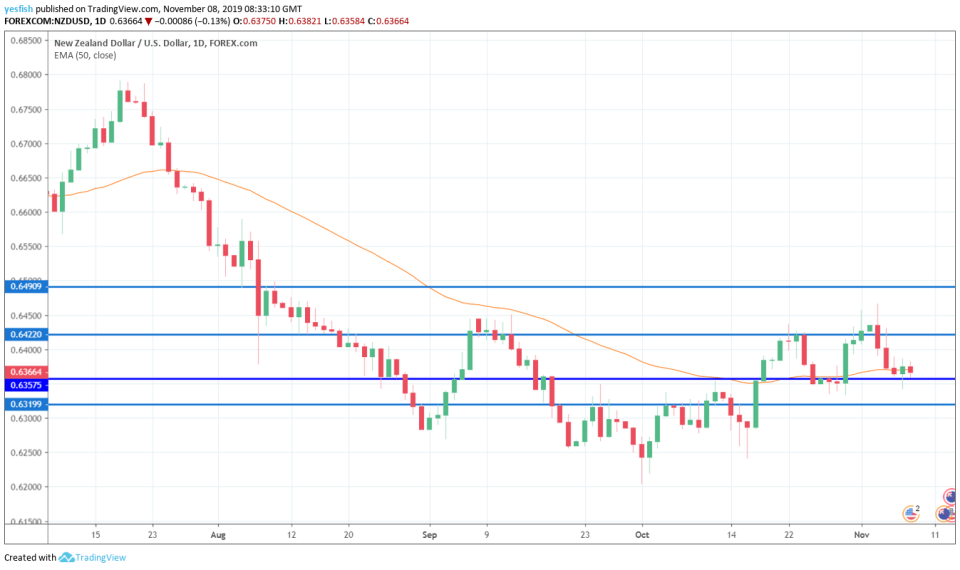
NZD/USD continues to trade sideways. In the European session, the pair is trading at 0.6368, down 0.11% on the day. There are no New Zealand releases on Friday.
NZD/USD Technical Analysis
NZD/USD ha been range-bound for most of the week. There is pressure on support at 0.6360, but the pair has shown little appetite to challenge this line. Below, there is support at 0.6330, which was last tested in mid-October. I continue to monitor the 50-EMA, as the line continues to touch Friday’s candlesticks.
This article was originally posted on FX Empire
