
 Yahoo Finance
 AUD/USD Forex Technical Analysis – .7079 to .7153 Major Retracement Zone Target
The Australian Dollar soared on Friday as investors continued to price in a 25-basis point rate cut by the U.S. Federal Reserve in late July. Buyers primarily ignored a report showing higher than expected U.S. consumer inflation on Thursday.
With the Fed cut mostly priced in, investors are likely to be influenced by two events this week. On Tuesday, the Reserve Bank of Australia (RBA) will release its monetary policy meeting minutes. On Thursday, traders will get the opportunity to react to a report on Employment Change and the Unemployment Rate.
On Friday, the AUD/USD settled at .7021, up 0.0045 or +0.65%.
Daily Swing Chart Technical Analysis
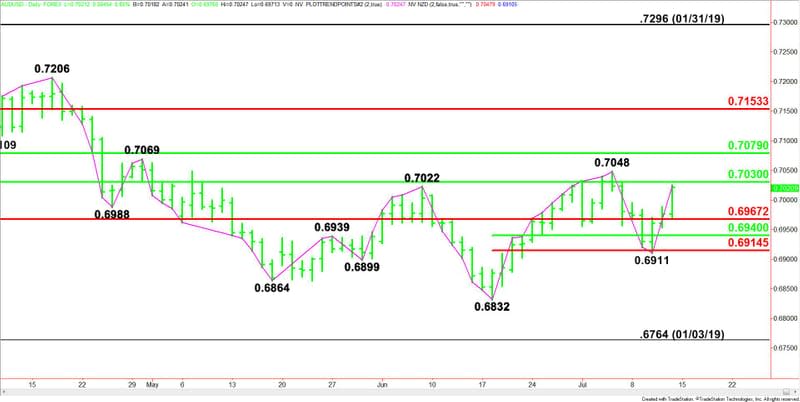
The main trend is up according to the daily swing chart. A trade through .7048 will reaffirm the uptrend. This is followed by another main top at .7069. Taking out this top could trigger a powerful breakout with the next target a main top at .7206.
The main trend will change to down on a trade through the swing bottom at .6911. This is followed by the next main bottom at .6832. This is the last bottom before the low of the year at .6764.
Two major retracement zones are influencing the price action.
The major range is .6394 to .6832. Its retracement zone at .7079 to .7153 is a major upside target.
The next major range is .6764 to .6296. Its retracement zone at .7030 to .6967 is currently being tested. Trader reaction to this range will determine the near-term direction of the Forex pair.
The short-term range is .6832 to .7048. Its retracement zone at .6940 to .6914 is support. It essentially stopped the selling at .6911 last week.
Daily Swing Chart Technical Forecast
Based on Friday’s strong upside momentum and the close at .7021, the direction of the AUD/USD on Monday is likely to be determined by trader reaction to the 50% level at .7030.
Bullish Scenario
A sustained move over .7030 will indicate the presence of buyers. Taking out the main top at .7048 will indicate the buying is getting stronger. This could trigger a rally into the next main top at .7069 and the major 50% level at .7079.
Look for sellers on the first test of .7079. Taking out this level, however, could trigger an acceleration to the upside with the next major target the major Fibonacci level at .7153.
Bearish Scenario
A sustained move under .7030 will signal the return of sellers. If this creates enough downside momentum then look for the selling to possibly extend into the Fibonacci level at .6967. If this fails then look for the selling to possibly extend into the short-term retracement zone at .6940 to .6914.
Taking out .6911 will change the main trend to down.
This article was originally posted on FX Empire
More From FXEMPIRE:
Gold Opens the Week with Sideways as China Reports a Good GDP
Natural Gas Price Forecast – Natural Gas rolls over on Monday
GBP/JPY Price Forecast – British pound fails to impress on weekly open
EUR/USD Price Forecast – Euro continues to run into resistance
USD/JPY Price Forecast – the US dollar fails to hang onto gains
