
 Yahoo Finance
 AUD/USD Forex Technical Analysis – Inside Move Signaling Investor Indecision, Impending Volatility
The AUD/USD closed higher on Friday despite the relatively low volume. The inside move indicates investor indecision and impending volatility.
Daily Technical Analysis
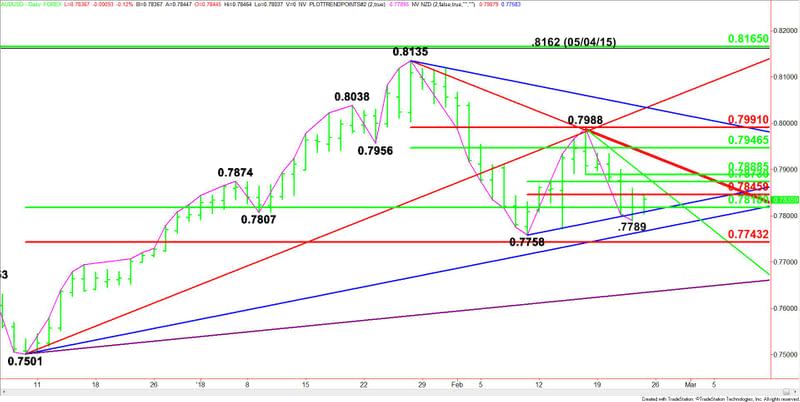
The main trend is down according to the daily swing chart. A trade through .7789 will indicate the selling is getting stronger. A trade through .7758 will reaffirm the downtrend.
The main trend will turn up on a move through .7988.
The main range is .7501 to .8135. Its retracement zone at .7818 to .7743 was successfully tested on February 9 at .7758 and at .7789 on February 22.
The intermediate range is .7758 to .7988. Trading below its retracement zone at .7873 to .7846 is helping to give the market a slight downside bias.
The short-term range is .7988 to .7789. Its 50% level or pivot is .7889. It is controlling the near-term direction of the Forex pair.

Daily Technical Forecast
Based on Friday’s close at .7836, the direction of the AUD/USD on Monday is likely to be determined by trader reaction to .7859 and .7789.
A trade through .7789 will indicate the presence of sellers. This could create the downside momentum needed to challenge a long-term uptrending Gann angle at .7766, followed closely by a main bottom at .7758 and a major Fibonacci level at .7743.
The Fib level at .7743 is a possible trigger point for an acceleration to the downside.
A trade through .7859 will signal the presence of buyers. This could trigger a labored rally with potential upside targets clustered at .7873, .7886 and a downtrending Gann angle at .7888.
The Gann angle at .7888 is the trigger point for a possible acceleration to the upside with a pair of downtrending Gann angles at .7935 and .7938 the major upside targets.
This article was originally posted on FX Empire
