
 Yahoo Finance
 ATCO Ltd. (TSE:ACO.X) Delivered A Weaker ROE Than Its Industry
While some investors are already well versed in financial metrics (hat tip), this article is for those who would like to learn about Return On Equity (ROE) and why it is important. To keep the lesson grounded in practicality, we'll use ROE to better understand ATCO Ltd. (TSE:ACO.X).
Return on equity or ROE is a key measure used to assess how efficiently a company's management is utilizing the company's capital. In short, ROE shows the profit each dollar generates with respect to its shareholder investments.
View our latest analysis for ATCO
How Is ROE Calculated?
ROE can be calculated by using the formula:
Return on Equity = Net Profit (from continuing operations) ÷ Shareholders' Equity
So, based on the above formula, the ROE for ATCO is:
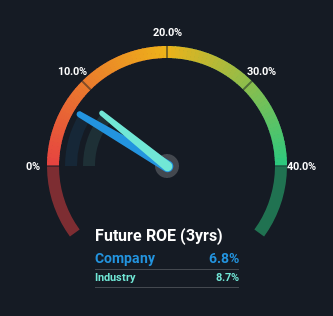
6.8% = CA$553m ÷ CA$8.1b (Based on the trailing twelve months to March 2022).
The 'return' is the income the business earned over the last year. Another way to think of that is that for every CA$1 worth of equity, the company was able to earn CA$0.07 in profit.
Does ATCO Have A Good ROE?
One simple way to determine if a company has a good return on equity is to compare it to the average for its industry. Importantly, this is far from a perfect measure, because companies differ significantly within the same industry classification. As is clear from the image below, ATCO has a lower ROE than the average (8.7%) in the Integrated Utilities industry.
Unfortunately, that's sub-optimal. That being said, a low ROE is not always a bad thing, especially if the company has low leverage as this still leaves room for improvement if the company were to take on more debt. When a company has low ROE but high debt levels, we would be cautious as the risk involved is too high. Our risks dashboard should have the 2 risks we have identified for ATCO.
How Does Debt Impact ROE?
Most companies need money -- from somewhere -- to grow their profits. The cash for investment can come from prior year profits (retained earnings), issuing new shares, or borrowing. In the case of the first and second options, the ROE will reflect this use of cash, for growth. In the latter case, the debt required for growth will boost returns, but will not impact the shareholders' equity. In this manner the use of debt will boost ROE, even though the core economics of the business stay the same.
Combining ATCO's Debt And Its 6.8% Return On Equity
ATCO does use a high amount of debt to increase returns. It has a debt to equity ratio of 1.22. The combination of a rather low ROE and significant use of debt is not particularly appealing. Debt does bring extra risk, so it's only really worthwhile when a company generates some decent returns from it.
Summary
Return on equity is useful for comparing the quality of different businesses. Companies that can achieve high returns on equity without too much debt are generally of good quality. All else being equal, a higher ROE is better.
But when a business is high quality, the market often bids it up to a price that reflects this. It is important to consider other factors, such as future profit growth -- and how much investment is required going forward. So you might want to check this FREE visualization of analyst forecasts for the company.
If you would prefer check out another company -- one with potentially superior financials -- then do not miss this free list of interesting companies, that have HIGH return on equity and low debt.
Have feedback on this article? Concerned about the content? Get in touch with us directly. Alternatively, email editorial-team (at) simplywallst.com.
This article by Simply Wall St is general in nature. We provide commentary based on historical data and analyst forecasts only using an unbiased methodology and our articles are not intended to be financial advice. It does not constitute a recommendation to buy or sell any stock, and does not take account of your objectives, or your financial situation. We aim to bring you long-term focused analysis driven by fundamental data. Note that our analysis may not factor in the latest price-sensitive company announcements or qualitative material. Simply Wall St has no position in any stocks mentioned.
