
 Yahoo Finance
 Arcosa's (NYSE:ACA) three-year total shareholder returns outpace the underlying earnings growth
One simple way to benefit from the stock market is to buy an index fund. But many of us dare to dream of bigger returns, and build a portfolio ourselves. Just take a look at Arcosa, Inc. (NYSE:ACA), which is up 69%, over three years, soundly beating the market return of 31% (not including dividends). On the other hand, the returns haven't been quite so good recently, with shareholders up just 26% , including dividends .
In light of the stock dropping 3.1% in the past week, we want to investigate the longer term story, and see if fundamentals have been the driver of the company's positive three-year return.
Check out our latest analysis for Arcosa
There is no denying that markets are sometimes efficient, but prices do not always reflect underlying business performance. One imperfect but simple way to consider how the market perception of a company has shifted is to compare the change in the earnings per share (EPS) with the share price movement.
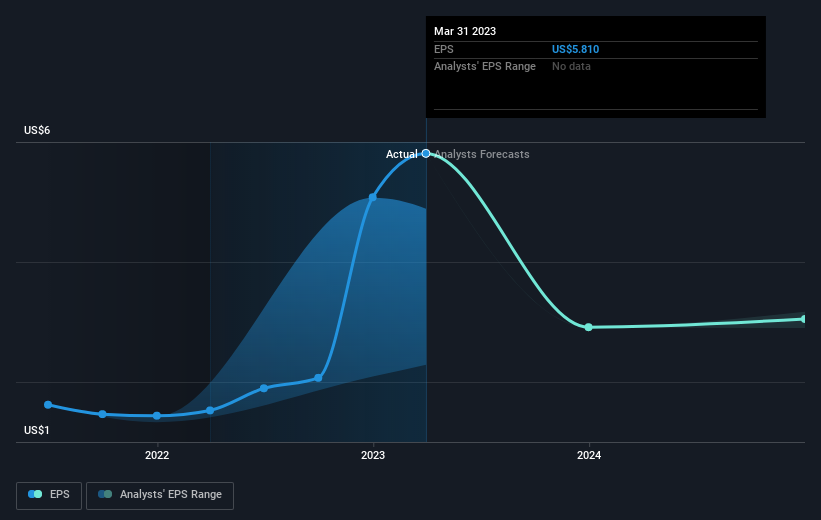
Arcosa was able to grow its EPS at 34% per year over three years, sending the share price higher. The average annual share price increase of 19% is actually lower than the EPS growth. Therefore, it seems the market has moderated its expectations for growth, somewhat. This cautious sentiment is reflected in its (fairly low) P/E ratio of 11.49.
You can see how EPS has changed over time in the image below (click on the chart to see the exact values).
We know that Arcosa has improved its bottom line over the last three years, but what does the future have in store? If you are thinking of buying or selling Arcosa stock, you should check out this FREE detailed report on its balance sheet.
A Different Perspective
We're pleased to report that Arcosa rewarded shareholders with a total shareholder return of 26% over the last year. That's including the dividend. That gain actually surpasses the 20% TSR it generated (per year) over three years. Given the track record of solid returns over varying time frames, it might be worth putting Arcosa on your watchlist. It's always interesting to track share price performance over the longer term. But to understand Arcosa better, we need to consider many other factors. Case in point: We've spotted 3 warning signs for Arcosa you should be aware of, and 1 of them is concerning.
For those who like to find winning investments this free list of growing companies with recent insider purchasing, could be just the ticket.
Please note, the market returns quoted in this article reflect the market weighted average returns of stocks that currently trade on American exchanges.
Have feedback on this article? Concerned about the content? Get in touch with us directly. Alternatively, email editorial-team (at) simplywallst.com.
This article by Simply Wall St is general in nature. We provide commentary based on historical data and analyst forecasts only using an unbiased methodology and our articles are not intended to be financial advice. It does not constitute a recommendation to buy or sell any stock, and does not take account of your objectives, or your financial situation. We aim to bring you long-term focused analysis driven by fundamental data. Note that our analysis may not factor in the latest price-sensitive company announcements or qualitative material. Simply Wall St has no position in any stocks mentioned.
Join A Paid User Research Session
You’ll receive a US$30 Amazon Gift card for 1 hour of your time while helping us build better investing tools for the individual investors like yourself. Sign up here
