
 Yahoo Finance
 Appian Corporation's (NASDAQ:APPN) P/S Still Appears To Be Reasonable
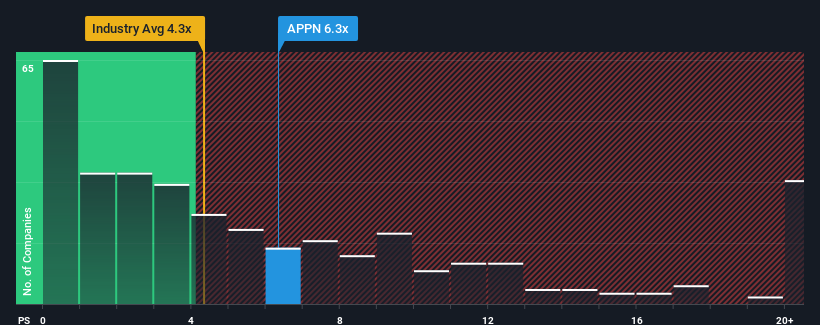
Appian Corporation's (NASDAQ:APPN) price-to-sales (or "P/S") ratio of 6.3x might make it look like a sell right now compared to the Software industry in the United States, where around half of the companies have P/S ratios below 4.3x and even P/S below 1.9x are quite common. Nonetheless, we'd need to dig a little deeper to determine if there is a rational basis for the elevated P/S.
See our latest analysis for Appian
How Has Appian Performed Recently?
Appian certainly has been doing a good job lately as it's been growing revenue more than most other companies. It seems that many are expecting the strong revenue performance to persist, which has raised the P/S. If not, then existing shareholders might be a little nervous about the viability of the share price.
Keen to find out how analysts think Appian's future stacks up against the industry? In that case, our free report is a great place to start.
Do Revenue Forecasts Match The High P/S Ratio?
Appian's P/S ratio would be typical for a company that's expected to deliver solid growth, and importantly, perform better than the industry.
If we review the last year of revenue growth, the company posted a terrific increase of 27%. The strong recent performance means it was also able to grow revenue by 80% in total over the last three years. Accordingly, shareholders would have definitely welcomed those medium-term rates of revenue growth.
Turning to the outlook, the next three years should generate growth of 16% per annum as estimated by the twelve analysts watching the company. Meanwhile, the rest of the industry is forecast to only expand by 13% each year, which is noticeably less attractive.
In light of this, it's understandable that Appian's P/S sits above the majority of other companies. It seems most investors are expecting this strong future growth and are willing to pay more for the stock.
What Does Appian's P/S Mean For Investors?
We'd say the price-to-sales ratio's power isn't primarily as a valuation instrument but rather to gauge current investor sentiment and future expectations.
We've established that Appian maintains its high P/S on the strength of its forecasted revenue growth being higher than the the rest of the Software industry, as expected. At this stage investors feel the potential for a deterioration in revenues is quite remote, justifying the elevated P/S ratio. It's hard to see the share price falling strongly in the near future under these circumstances.
Before you settle on your opinion, we've discovered 2 warning signs for Appian that you should be aware of.
If companies with solid past earnings growth is up your alley, you may wish to see this free collection of other companies with strong earnings growth and low P/E ratios.
Have feedback on this article? Concerned about the content? Get in touch with us directly. Alternatively, email editorial-team (at) simplywallst.com.
This article by Simply Wall St is general in nature. We provide commentary based on historical data and analyst forecasts only using an unbiased methodology and our articles are not intended to be financial advice. It does not constitute a recommendation to buy or sell any stock, and does not take account of your objectives, or your financial situation. We aim to bring you long-term focused analysis driven by fundamental data. Note that our analysis may not factor in the latest price-sensitive company announcements or qualitative material. Simply Wall St has no position in any stocks mentioned.
Join A Paid User Research Session
You’ll receive a US$30 Amazon Gift card for 1 hour of your time while helping us build better investing tools for the individual investors like yourself. Sign up here
