
 Yahoo Finance
 Announcing: RealPage (NASDAQ:RP) Stock Increased An Energizing 176% In The Last Five Years

It hasn't been the best quarter for RealPage, Inc. (NASDAQ:RP) shareholders, since the share price has fallen 11% in that time. But that doesn't change the fact that shareholders have received really good returns over the last five years. In fact, the share price is 176% higher today. Generally speaking the long term returns will give you a better idea of business quality than short periods can. Only time will tell if there is still too much optimism currently reflected in the share price.
Check out our latest analysis for RealPage
While the efficient markets hypothesis continues to be taught by some, it has been proven that markets are over-reactive dynamic systems, and investors are not always rational. By comparing earnings per share (EPS) and share price changes over time, we can get a feel for how investor attitudes to a company have morphed over time.
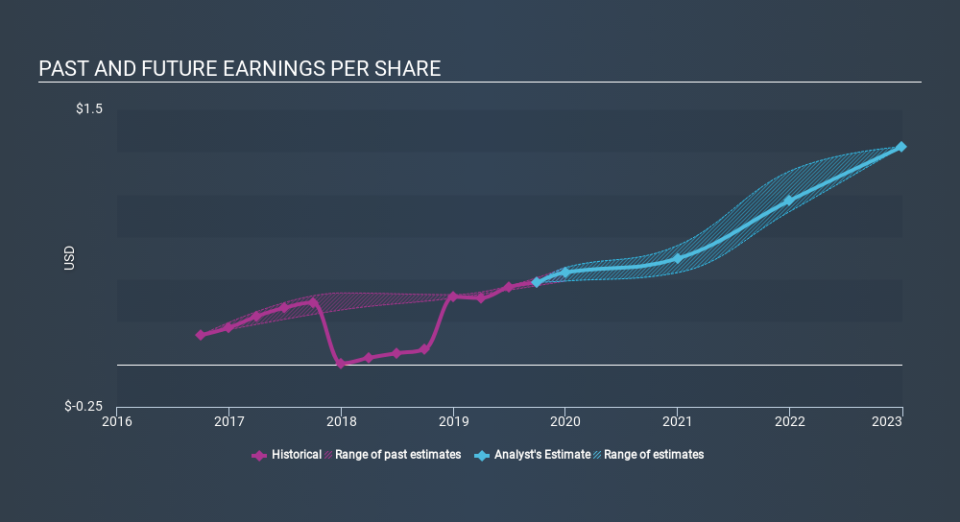
During the five years of share price growth, RealPage moved from a loss to profitability. Sometimes, the start of profitability is a major inflection point that can signal fast earnings growth to come, which in turn justifies very strong share price gains. Since the company was unprofitable five years ago, but not three years ago, it's worth taking a look at the returns in the last three years, too. Indeed, the RealPage share price has gained 90% in three years. Meanwhile, EPS is up 41% per year. This EPS growth is higher than the 24% average annual increase in the share price over the same three years. Therefore, it seems the market has moderated its expectations for growth, somewhat. Having said that, the market is still optimistic, given the P/E ratio of 114.40.
You can see how EPS has changed over time in the image below (click on the chart to see the exact values).
We know that RealPage has improved its bottom line over the last three years, but what does the future have in store? This free interactive report on RealPage's balance sheet strength is a great place to start, if you want to investigate the stock further.
A Different Perspective
RealPage shareholders are up 3.5% for the year. But that return falls short of the market. If we look back over five years, the returns are even better, coming in at 22% per year for five years. It's quite possible the business continues to execute with prowess, even as the share price gains are slowing. Before spending more time on RealPage it might be wise to click here to see if insiders have been buying or selling shares.
Of course RealPage may not be the best stock to buy. So you may wish to see this free collection of growth stocks.
Please note, the market returns quoted in this article reflect the market weighted average returns of stocks that currently trade on US exchanges.
If you spot an error that warrants correction, please contact the editor at editorial-team@simplywallst.com. This article by Simply Wall St is general in nature. It does not constitute a recommendation to buy or sell any stock, and does not take account of your objectives, or your financial situation. Simply Wall St has no position in the stocks mentioned.
We aim to bring you long-term focused research analysis driven by fundamental data. Note that our analysis may not factor in the latest price-sensitive company announcements or qualitative material. Thank you for reading.
