
 Yahoo Finance
 These Analysts Just Made An Downgrade To Their GoodRx Holdings, Inc. (NASDAQ:GDRX) EPS Forecasts
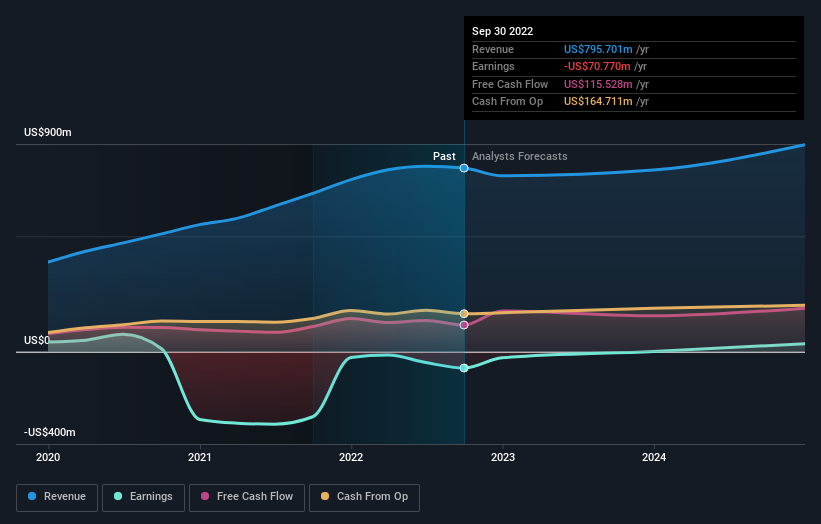
Market forces rained on the parade of GoodRx Holdings, Inc. (NASDAQ:GDRX) shareholders today, when the analysts downgraded their forecasts for next year. Revenue and earnings per share (EPS) forecasts were both revised downwards, with analysts seeing grey clouds on the horizon.
Following this downgrade, GoodRx Holdings' 19 analysts are forecasting 2023 revenues to be US$787m, approximately in line with the last 12 months. The loss per share is anticipated to greatly reduce in the near future, narrowing 98% to US$0.0038. Before this latest update, the analysts had been forecasting revenues of US$892m and earnings per share (EPS) of US$0.053 in 2023. There looks to have been a major change in sentiment regarding GoodRx Holdings' prospects, with a measurable cut to revenues and the analysts now forecasting a loss instead of a profit.
See our latest analysis for GoodRx Holdings
The consensus price target fell 23% to US$7.25, implicitly signalling that lower earnings per share are a leading indicator for GoodRx Holdings' valuation. Fixating on a single price target can be unwise though, since the consensus target is effectively the average of analyst price targets. As a result, some investors like to look at the range of estimates to see if there are any diverging opinions on the company's valuation. There are some variant perceptions on GoodRx Holdings, with the most bullish analyst valuing it at US$11.00 and the most bearish at US$4.50 per share. Note the wide gap in analyst price targets? This implies to us that there is a fairly broad range of possible scenarios for the underlying business.
These estimates are interesting, but it can be useful to paint some more broad strokes when seeing how forecasts compare, both to the GoodRx Holdings' past performance and to peers in the same industry. These estimates imply that sales are expected to slow, with a forecast annualised revenue decline of 0.9% by the end of 2023. This indicates a significant reduction from annual growth of 26% over the last three years. Compare this with our data, which suggests that other companies in the same industry are, in aggregate, expected to see their revenue grow 13% per year. So although its revenues are forecast to shrink, this cloud does not come with a silver lining - GoodRx Holdings is expected to lag the wider industry.
The Bottom Line
The most important thing to take away is that analysts are expecting GoodRx Holdings to become unprofitable next year. Unfortunately analysts also downgraded their revenue estimates, and industry data suggests that GoodRx Holdings' revenues are expected to grow slower than the wider market. With a serious cut to next year's expectations and a falling price target, we wouldn't be surprised if investors were becoming wary of GoodRx Holdings.
With that said, the long-term trajectory of the company's earnings is a lot more important than next year. At Simply Wall St, we have a full range of analyst estimates for GoodRx Holdings going out to 2024, and you can see them free on our platform here.
Another way to search for interesting companies that could be reaching an inflection point is to track whether management are buying or selling, with our free list of growing companies that insiders are buying.
Have feedback on this article? Concerned about the content? Get in touch with us directly. Alternatively, email editorial-team (at) simplywallst.com.
This article by Simply Wall St is general in nature. We provide commentary based on historical data and analyst forecasts only using an unbiased methodology and our articles are not intended to be financial advice. It does not constitute a recommendation to buy or sell any stock, and does not take account of your objectives, or your financial situation. We aim to bring you long-term focused analysis driven by fundamental data. Note that our analysis may not factor in the latest price-sensitive company announcements or qualitative material. Simply Wall St has no position in any stocks mentioned.
Join A Paid User Research Session
You’ll receive a US$30 Amazon Gift card for 1 hour of your time while helping us build better investing tools for the individual investors like yourself. Sign up here
