
 Yahoo Finance
 AMERCO (NASDAQ:UHAL) Is Going Strong But Fundamentals Appear To Be Mixed : Is There A Clear Direction For The Stock?

AMERCO's (NASDAQ:UHAL) stock is up by a considerable 13% over the past three months. However, we wonder if the company's inconsistent financials would have any adverse impact on the current share price momentum. In this article, we decided to focus on AMERCO's ROE.
Return on equity or ROE is a key measure used to assess how efficiently a company's management is utilizing the company's capital. Put another way, it reveals the company's success at turning shareholder investments into profits.
View our latest analysis for AMERCO
How Do You Calculate Return On Equity?
The formula for ROE is:
Return on Equity = Net Profit (from continuing operations) ÷ Shareholders' Equity
So, based on the above formula, the ROE for AMERCO is:
9.3% = US$397m ÷ US$4.3b (Based on the trailing twelve months to June 2020).
The 'return' is the profit over the last twelve months. One way to conceptualize this is that for each $1 of shareholders' capital it has, the company made $0.09 in profit.
What Is The Relationship Between ROE And Earnings Growth?
Thus far, we have learned that ROE measures how efficiently a company is generating its profits. Depending on how much of these profits the company reinvests or "retains", and how effectively it does so, we are then able to assess a company’s earnings growth potential. Assuming everything else remains unchanged, the higher the ROE and profit retention, the higher the growth rate of a company compared to companies that don't necessarily bear these characteristics.
AMERCO's Earnings Growth And 9.3% ROE
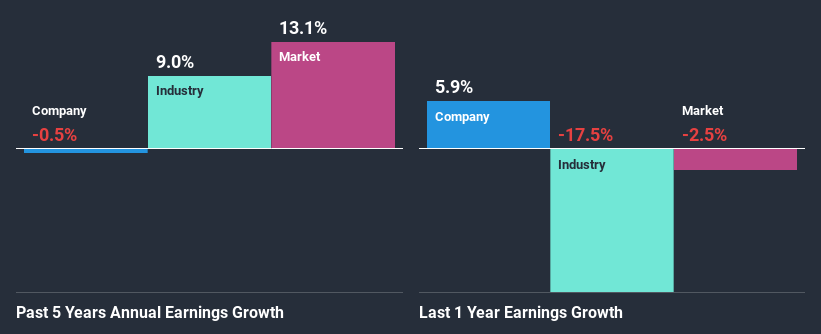
When you first look at it, AMERCO's ROE doesn't look that attractive. Next, when compared to the average industry ROE of 13%, the company's ROE leaves us feeling even less enthusiastic. Therefore, AMERCO's flat earnings over the past five years can possibly be explained by the low ROE amongst other factors.
Next, on comparing with the industry net income growth, we found that the industry grew its earnings by9.0% in the same period.
The basis for attaching value to a company is, to a great extent, tied to its earnings growth. The investor should try to establish if the expected growth or decline in earnings, whichever the case may be, is priced in. By doing so, they will have an idea if the stock is headed into clear blue waters or if swampy waters await. Is AMERCO fairly valued compared to other companies? These 3 valuation measures might help you decide.
Is AMERCO Efficiently Re-investing Its Profits?
Summary
On the whole, we feel that the performance shown by AMERCO can be open to many interpretations. Even though it appears to be retaining most of its profits, given the low ROE, investors may not be benefitting from all that reinvestment after all. The low earnings growth suggests our theory correct. Additionally, the latest industry analyst forecasts show that analysts expect the company's earnings to continue to shrink in the future. To know more about the company's future earnings growth forecasts take a look at this free report on analyst forecasts for the company to find out more.
This article by Simply Wall St is general in nature. It does not constitute a recommendation to buy or sell any stock, and does not take account of your objectives, or your financial situation. We aim to bring you long-term focused analysis driven by fundamental data. Note that our analysis may not factor in the latest price-sensitive company announcements or qualitative material. Simply Wall St has no position in any stocks mentioned.
Have feedback on this article? Concerned about the content? Get in touch with us directly. Alternatively, email editorial-team@simplywallst.com.
