
 Yahoo Finance
 Amcor's (NYSE:AMCR) earnings growth rate lags the 8.4% CAGR delivered to shareholders
While Amcor plc (NYSE:AMCR) shareholders are probably generally happy, the stock hasn't had particularly good run recently, with the share price falling 14% in the last quarter. On the other hand the share price is higher than it was three years ago. In that time, it is up 13%, which isn't bad, but not amazing either.
Since the long term performance has been good but there's been a recent pullback of 3.6%, let's check if the fundamentals match the share price.
Check out our latest analysis for Amcor
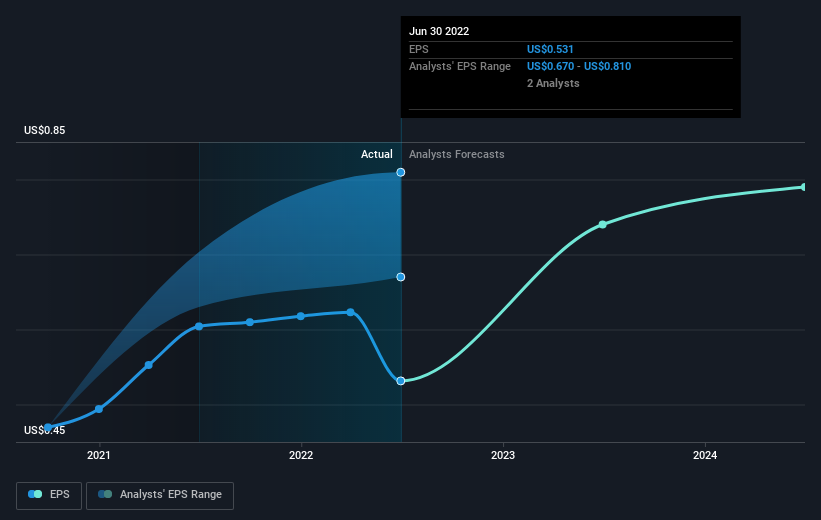
While markets are a powerful pricing mechanism, share prices reflect investor sentiment, not just underlying business performance. One imperfect but simple way to consider how the market perception of a company has shifted is to compare the change in the earnings per share (EPS) with the share price movement.
During three years of share price growth, Amcor achieved compound earnings per share growth of 14% per year. This EPS growth is higher than the 4% average annual increase in the share price. Therefore, it seems the market has moderated its expectations for growth, somewhat.
The graphic below depicts how EPS has changed over time (unveil the exact values by clicking on the image).
It might be well worthwhile taking a look at our free report on Amcor's earnings, revenue and cash flow.
What About Dividends?
It is important to consider the total shareholder return, as well as the share price return, for any given stock. The TSR is a return calculation that accounts for the value of cash dividends (assuming that any dividend received was reinvested) and the calculated value of any discounted capital raisings and spin-offs. Arguably, the TSR gives a more comprehensive picture of the return generated by a stock. We note that for Amcor the TSR over the last 3 years was 27%, which is better than the share price return mentioned above. This is largely a result of its dividend payments!
A Different Perspective
Amcor shareholders may not have made money over the last year, but their total loss of 3.5% ( including dividends) isn't as bad as the market loss of around 3.5%. Longer term investors wouldn't be so upset, since they would have made 8%, each year, over three years. It's possible that the recent share price decline has more to do with the negative broader market returns than any company specific development. It's always interesting to track share price performance over the longer term. But to understand Amcor better, we need to consider many other factors. To that end, you should be aware of the 3 warning signs we've spotted with Amcor .
But note: Amcor may not be the best stock to buy. So take a peek at this free list of interesting companies with past earnings growth (and further growth forecast).
Please note, the market returns quoted in this article reflect the market weighted average returns of stocks that currently trade on US exchanges.
Have feedback on this article? Concerned about the content? Get in touch with us directly. Alternatively, email editorial-team (at) simplywallst.com.
This article by Simply Wall St is general in nature. We provide commentary based on historical data and analyst forecasts only using an unbiased methodology and our articles are not intended to be financial advice. It does not constitute a recommendation to buy or sell any stock, and does not take account of your objectives, or your financial situation. We aim to bring you long-term focused analysis driven by fundamental data. Note that our analysis may not factor in the latest price-sensitive company announcements or qualitative material. Simply Wall St has no position in any stocks mentioned.
Join A Paid User Research Session
You’ll receive a US$30 Amazon Gift card for 1 hour of your time while helping us build better investing tools for the individual investors like yourself. Sign up here
