
 Yahoo Finance
 Amarin (NASDAQ:AMRN shareholders incur further losses as stock declines 9.4% this week, taking three-year losses to 80%
It's not possible to invest over long periods without making some bad investments. But really big losses can really drag down an overall portfolio. So spare a thought for the long term shareholders of Amarin Corporation plc (NASDAQ:AMRN); the share price is down a whopping 80% in the last three years. That would be a disturbing experience. Shareholders have had an even rougher run lately, with the share price down 14% in the last 90 days. This could be related to the recent financial results - you can catch up on the most recent data by reading our company report. We really hope anyone holding through that price crash has a diversified portfolio. Even when you lose money, you don't have to lose the lesson.
Given the past week has been tough on shareholders, let's investigate the fundamentals and see what we can learn.
View our latest analysis for Amarin
Amarin isn't currently profitable, so most analysts would look to revenue growth to get an idea of how fast the underlying business is growing. Generally speaking, companies without profits are expected to grow revenue every year, and at a good clip. That's because it's hard to be confident a company will be sustainable if revenue growth is negligible, and it never makes a profit.
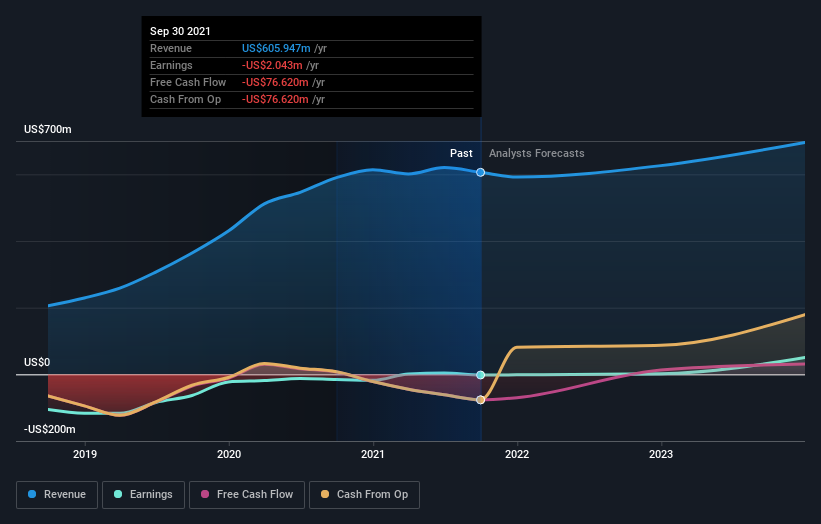
Over three years, Amarin grew revenue at 35% per year. That is faster than most pre-profit companies. So why has the share priced crashed 22% per year, in the same time? The share price makes us wonder if there is an issue with profitability. Ultimately, revenue growth doesn't amount to much if the business can't scale well. If the company is low on cash, it may have to raise capital soon.
The company's revenue and earnings (over time) are depicted in the image below (click to see the exact numbers).
We like that insiders have been buying shares in the last twelve months. Having said that, most people consider earnings and revenue growth trends to be a more meaningful guide to the business. You can see what analysts are predicting for Amarin in this interactive graph of future profit estimates.
A Different Perspective
Amarin shareholders are down 6.2% for the year, but the market itself is up 33%. However, keep in mind that even the best stocks will sometimes underperform the market over a twelve month period. On the bright side, long term shareholders have made money, with a gain of 7% per year over half a decade. It could be that the recent sell-off is an opportunity, so it may be worth checking the fundamental data for signs of a long term growth trend. I find it very interesting to look at share price over the long term as a proxy for business performance. But to truly gain insight, we need to consider other information, too. For example, we've discovered 1 warning sign for Amarin that you should be aware of before investing here.
If you like to buy stocks alongside management, then you might just love this free list of companies. (Hint: insiders have been buying them).
Please note, the market returns quoted in this article reflect the market weighted average returns of stocks that currently trade on US exchanges.
This article by Simply Wall St is general in nature. We provide commentary based on historical data and analyst forecasts only using an unbiased methodology and our articles are not intended to be financial advice. It does not constitute a recommendation to buy or sell any stock, and does not take account of your objectives, or your financial situation. We aim to bring you long-term focused analysis driven by fundamental data. Note that our analysis may not factor in the latest price-sensitive company announcements or qualitative material. Simply Wall St has no position in any stocks mentioned.
Have feedback on this article? Concerned about the content? Get in touch with us directly. Alternatively, email editorial-team (at) simplywallst.com.
